

Consumer Insights
Uncover trends and behaviors shaping consumer choices today
Procurement Insights
Optimize your sourcing strategy with key market data
Industry Stats
Stay ahead with the latest trends and market analysis.
Trending Now


Base Year
Historical Year
Forecast Year


The global voice assistant application market size reached USD 4.10 billion in 2024. The market is expected to grow at a CAGR of 24.5% between 2025 and 2034, reaching almost USD 29.27 billion by 2034.
A voice assistant employs voice recognition, synthesis, and language processing algorithms to interpret specific voice commands from users. It is known as an intelligent personal assistant or connected speaker, often integrated into smart devices for task execution. The adoption of voice assistants in daily life is on the rise due to rapid advancements in technology. These applications simplify tasks such as online ordering and appointment scheduling.
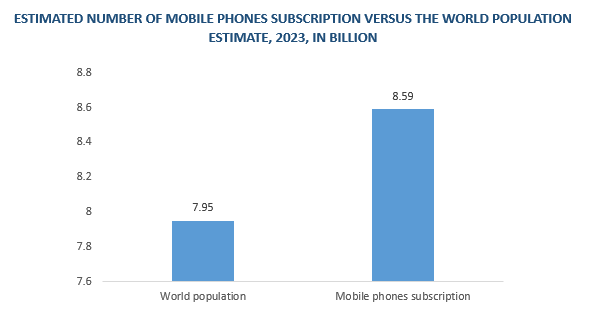
Many vendors offer voice assistant applications with advanced features like artificial intelligence (AI), speech conversion, and edge computing. Widely recognized voice assistant applications include Apple's Siri, Microsoft's Cortana, Amazon's Alexa, and Google's Assistant. The increasing use of the internet and smart devices among consumers significantly drives the global voice assistant application market growth.
As per the International Telecommunication Union, around 67 per cent of the global population, equivalent to 5.4 billion individuals, now has internet access.


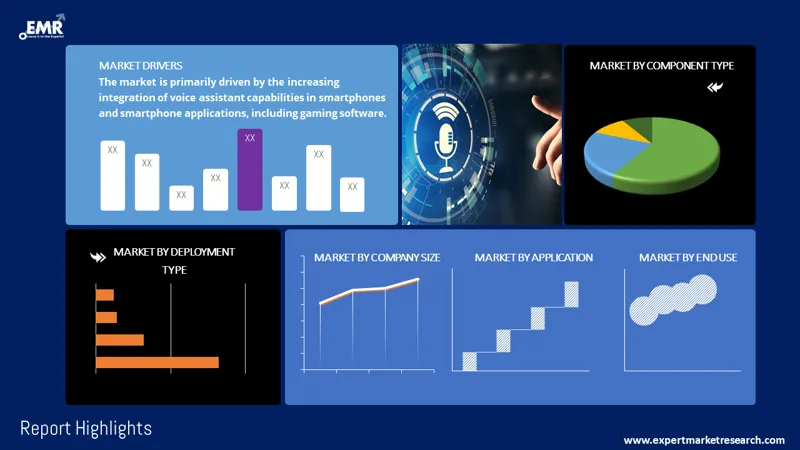
The global voice assistant application market is driven by advancements in conversational AI, integration with smart devices, improved personalization, and a strong focus on accessibility.
Voice assistants are evolving to engage users in more natural conversations, mimicking human dialogue. Progress in natural language processing (NLP) enables smoother interactions, ultimately boosting user satisfaction and involvement with the technology.
The global voice assistant application market development is driven by integration with smart devices, enabling control over entire smart home systems. This convenience and automation appeal to users, thus, fostering market expansion.
As per the global voice assistant application analysis, the user experience is enhanced by leveraging data analytics, personalized suggestions, services, and content tailored to user preferences and behaviour.
Voice assistants are improving accessibility features, assisting individuals with disabilities through voice-operated interfaces for devices and services. This promotes inclusivity and ease of use.
Voice assistants are seamlessly blending with Internet of Things (IoT) gadgets, allowing users to effortlessly command and oversee smart home appliances using voice prompts. The surge in voice-activated shopping permits users to buy items, create orders, and handle subscriptions simply by using voice instructions, simplifying the shopping experience.
As per the global voice assistant application market report, voice assistants are employed for tasks like scheduling appointments, reminding users of medications, and accessing health-related information. Emphasis is placed on safeguarding data, providing choices for data management and secure voice recognition.
Read more about this report - REQUEST FREE SAMPLE COPY IN PDF
Global Voice Assistant Application Market Report and Forecast 2024-2032 offers a detailed analysis of the market based on the following segments:
Market Breakup by Component
Market Breakup by Deployment Type
Market Breakup by Company Size
Market Breakup by Application
Market Breakup by End Use
Market Breakup by Region
Cloud deployment significantly enhances the global voice assistant application market as it ensures accessibility across various devices, facilitating seamless interactions across platforms like smartphones, smart speakers, and IoT devices
Utilizing cloud infrastructure allows developers of voice assistant applications to cut costs related to maintaining hardware and setting up infrastructure. They only pay for the computing resources they use, ensuring cost-effectiveness.
On-premises voice assistant applications emphasize enhanced privacy and security since user data is confined within the local environment.
Mobile applications contribute significantly to the global voice assistant application market growth since they can be tailored and optimized to leverage the specific features and capabilities of mobile devices
Mobile apps offer users the ability to carry out voice commands and tasks even when they do not have an internet connection, providing offline functionality.
Web apps are available on any device with a web browser, extending voice assistant features to various platforms such as desktops, laptops, tablets, and smartphones.
In terms of end use, the global voice assistant application market share is led by retail and e-commerce by offering customers a hands-free and intuitive method to engage with e-commerce platforms
Voice assistants make conversational commerce possible, allowing users to ask about products, receive suggestions, and finalize purchases using natural language.
Within healthcare, professionals employ voice assistants to access patient records, take notes, and schedule appointments, streamlining operations and improving workflow efficiency.
Read more about this report - REQUEST FREE SAMPLE COPY IN PDF
The competition in the global voice assistant application market is characterized by offering expertise in AI, online advertising, search engines, and e-commerce.
established in 1911 and headquartered in the United States, is a leading global IT company with operations spanning more than 170 countries. Renowned for its hardware and software solutions, IBM offers a diverse range of products such as computers, servers, storage systems, and networking equipment.
founded in 1998 in the US, stands as a multinational technology behemoth specializing in AI, online advertising, search engines, cloud computing, software development, quantum computing, e-commerce, and consumer electronics.
was founded in 2006 and provides a comprehensive array of cloud-based services on a global scale. These services encompass computing, storage, databases, analytics, networking, mobile solutions, developer tools, management tools, IoT, security offerings, and enterprise applications. AWS services are instantly accessible upon request, with pricing structured on a pay-as-you-go model.
established in 1975 and headquartered in the United States, focuses on the development, licensing, and support of an extensive portfolio of enterprise and consumer software products and services. Microsoft's offerings include operating systems tailored for personal computers, servers, and mobile devices, along with server applications, management tools, and productivity applications.
*Please note that this is only a partial list; the complete list of key players is available in the full report. Additionally, the list of key players can be customized to better suit your needs.*
Other key players in the global voice assistant application market are Apple Inc., Samsung Electronics Co., Ltd., Cisco, Oracle, SAP SE, and Verint System Inc. among others.
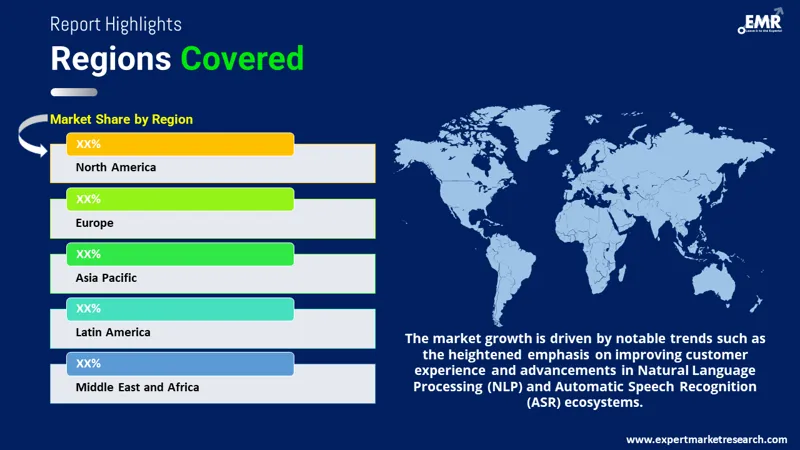
Based on region, the global voice assistant application market share is led by North America due to its robust technological infrastructure, facilitating the development and deployment of advanced AI and machine learning models that are essential for high-performing voice assistants. The region's high-speed internet connectivity and widespread use of smart devices provide an ideal environment for efficient voice assistant operations.
Statistics Canada shows an increase in Canadian seniors owning smartphones, rising from 80% in 2018 to 84% in 2020. This supports the global voice assistant market, aiding the elderly with various benefits, such as hands-free operation and health monitoring, promoting independence and well-being.
In the Asia Pacific region, the population demonstrates a widespread technology-friendly mindset and a readiness to adopt sophisticated technologies in daily tasks, ranging from online shopping to managing healthcare. This presents a substantial, pre-established market for voice assistant applications across diverse sectors.
Voice Assistant Application Market Size
Voice Assistant Application Market Trends
*While we strive to always give you current and accurate information, the numbers depicted on the website are indicative and may differ from the actual numbers in the main report. At Expert Market Research, we aim to bring you the latest insights and trends in the market. Using our analyses and forecasts, stakeholders can understand the market dynamics, navigate challenges, and capitalize on opportunities to make data-driven strategic decisions.*
Get in touch with us for a customized solution tailored to your unique requirements and save upto 35%!
The market was estimated to be valued at USD 4.10 billion in 2024.
The market is projected to grow at a CAGR of 24.5% between 2025 and 2034.
The revenue generated from the voice assistant application market is expected to reach USD 29.27 billion in 2034.
The growth of the voice assistant application market is driven by advancements in conversational AI, integration with smart devices, improved personalization, and a strong focus on accessibility.
The market is categorised according to its component types, which include solutions and services.
The key players are IBM Corporation, Alphabet, Inc., Amazon Web Services Inc., Microsoft Corporation, Apple Inc., Samsung Electronics Co., Ltd., Cisco, Oracle, SAP SE, and Verint System Inc. among others.
Based on the deployment type, the market is divided into on-premises and cloud.
The major areas include North America, Europe, the Asia Pacific, Latin America, and the Middle East and Africa.
Based on the industry, the market is divided into banking, financial services, and insurance, healthcare, retail and e-commerce, media and entertainment, telecom and IT, manufacturing and automotive, education, travel and hospitality and others.
Explore our key highlights of the report and gain a concise overview of key findings, trends, and actionable insights that will empower your strategic decisions.
| REPORT FEATURES | DETAILS |
| Base Year | 2024 |
| Historical Period | 2018-2024 |
| Forecast Period | 2025-2034 |
| Scope of the Report |
Historical and Forecast Trends, Industry Drivers and Constraints, Historical and Forecast Market Analysis by Segment:
|
| Breakup by Component Type |
|
| Breakup by Deployment Type |
|
| Breakup by Company Size |
|
| Breakup by Application |
|
| Breakup by End Use |
|
| Breakup by Region |
|
| Market Dynamics |
|
| Competitive Landscape |
|
| Companies Covered |
|
| Report Price and Purchase Option | Explore our purchase options that are best suited to your resources and industry needs. |
| Delivery Format | Delivered as an attached PDF and Excel through email, with an option of receiving an editable PPT, according to the purchase option |
Single User License
One User
USD 3,999
USD 3,599
tax inclusive*
Datasheet
One User
USD 2,499
USD 2,249
tax inclusive*
Five User License
Five User
USD 4,999
USD 4,249
tax inclusive*
Corporate License
Unlimited Users
USD 5,999
USD 5,099
tax inclusive*
*Please note that the prices mentioned below are starting prices for each bundle type. Kindly contact our team for further details.*
Flash Bundle
Small Business Bundle
Growth Bundle
Enterprise Bundle
*Please note that the prices mentioned below are starting prices for each bundle type. Kindly contact our team for further details.*
Flash Bundle
Number of Reports: 3
20%
tax inclusive*
Small Business Bundle
Number of Reports: 5
25%
tax inclusive*
Growth Bundle
Number of Reports: 8
30%
tax inclusive*
Enterprise Bundle
Number of Reports: 10
35%
tax inclusive*
How To Order
Our step-by-step guide will help you select, purchase, and access your reports swiftly, ensuring you get the information that drives your decisions, right when you need it.

Select License Type
Choose the right license for your needs and access rights.

Click on ‘Buy Now’
Add the report to your cart with one click and proceed to register.

Select Mode of Payment
Choose a payment option for a secure checkout. You will be redirected accordingly.
Track prices with detailed trend reports.

Analyse trade data for supply chain insights.

Leverage cost reports for smart savings

Enhance supply chain with partnerships.

Gain insights to stay ahead and seize opportunities.

Get insights & trends for a competitive edge.

Track prices with detailed trend reports.
Analyse trade data for supply chain insights.
Leverage cost reports for smart savings
Enhance supply chain with partnerships.
Gain insights to stay ahead and seize opportunities.
Get insights & trends for a competitive edge.
Track prices with detailed trend reports.
Analyse trade data for supply chain insights.
Connect For More Information
Our expert team of analysts will offer full support and resolve any queries regarding the report, before and after the purchase.
Our expert team of analysts will offer full support and resolve any queries regarding the report, before and after the purchase.
We employ meticulous research methods, blending advanced analytics and expert insights to deliver accurate, actionable industry intelligence, staying ahead of competitors.
Our skilled analysts offer unparalleled competitive advantage with detailed insights on current and emerging markets, ensuring your strategic edge.
We offer an in-depth yet simplified presentation of industry insights and analysis to meet your specific requirements effectively.
Australia
63 Fiona Drive, Tamworth, NSW
+61-448-061-727
India
C130 Sector 2 Noida, Uttar Pradesh 201301
+91-723-689-1189
Philippines
40th Floor, PBCom Tower, 6795 Ayala Avenue Cor V.A Rufino St. Makati City,1226.
+63-287-899-028, +63-967-048-3306
United Kingdom
6 Gardner Place, Becketts Close, Feltham TW14 0BX, Greater London
+44-753-713-2163
United States
30 North Gould Street, Sheridan, WY 82801
+1-415-325-5166
Vietnam
193/26/4 St.no.6, Ward Binh Hung Hoa, Binh Tan District, Ho Chi Minh City
+84-865-399-124
United States (Head Office)
30 North Gould Street, Sheridan, WY 82801
+1-415-325-5166
Australia
63 Fiona Drive, Tamworth, NSW
+61-448-061-727
India
C130 Sector 2 Noida, Uttar Pradesh 201301
+91-723-689-1189
Philippines
40th Floor, PBCom Tower, 6795 Ayala Avenue Cor V.A Rufino St. Makati City, 1226.
+63-287-899-028, +63-967-048-3306
United Kingdom
6 Gardner Place, Becketts Close, Feltham TW14 0BX, Greater London
+44-753-713-2163
Vietnam
193/26/4 St.no.6, Ward Binh Hung Hoa, Binh Tan District, Ho Chi Minh City
+84-865-399-124


Share