

Consumer Insights
Uncover trends and behaviors shaping consumer choices today
Procurement Insights
Optimize your sourcing strategy with key market data
Industry Stats
Stay ahead with the latest trends and market analysis.

The United States shrimp market reached a volume of 846.90 KMT in 2025. The market is expected to grow at a CAGR of 2.40% during the forecast period of 2026-2035 to reach a volume of 1073.57 KMT by 2035. Expansion of cold chain logistics across all seafood hubs is driving higher year-round shrimp availability, minimizing spoilage risks, and reinforcing market efficiency through robust distribution networks.
The market growth is surging exponentially, propelled by evolving consumer demands, policy support, and technological innovation. One of the most transformative driving factors of the United States shrimp market growth is the expansion of domestic aquaculture, particularly the adoption of land-based recirculating aquaculture systems (RAS). Facilities like Homegrown Shrimp USA in Florida are pioneering antibiotic-free shrimp production, setting benchmarks in sustainability. In addition, USDA programs purchased over 232,500 cases of peeled and deveined shrimp in as per March 2025 industry reports, while allocating USD 24.7 million in contracts to Louisiana-based processors to strengthen nutrition programs.
According to the United States shrimp market analysis, shrimp remained the top seafood choice with Americans consuming nearly 19.7 pounds per capita in 2022. This preference is reinforced by shrimp appearing on almost 47% of restaurant menus across the nation, showcasing its versatility and broad foodservice integration. E-commerce and direct-to-consumer seafood delivery platforms are further extending its reach, bringing traceable and high-quality shrimp directly into American households.
Base Year
Historical Period
Forecast Period
As per the data from the National Oceanic and Atmospheric Administration, around 79% of the seafood, including shrimp was imported into the country.
The three main shrimp importing countries to the USA are India, Indonesia, and Vietnam.
In 2021, shrimp was the most consumed seafood in the USA with an average consumption of 5.9 pounds of shrimp per person.
Compound Annual Growth Rate
2.4%
Value in KMT
2026-2035
*this image is indicative*
| United States Shrimp Market Report Summary | Description | Value |
| Base Year | KMT | 2025 |
| Historical Period | KMT | 2019-2025 |
| Forecast Period | KMT | 2026-2035 |
| Market Size 2025 | KMT | 846.90 |
| Market Size 2035 | KMT | 1073.57 |
| CAGR 2019-2025 | Percentage | XX% |
| CAGR 2026-2035 | Percentage | 2.40% |
| CAGR 2026-2035 - Market by Distribution Channel | Online Stores | 4.6% |
| CAGR 2026-2035 - Market by Production and Imports | Domestic Production | 2.2% |
| 2025 Market Share by Distribution Channel | Online Stores | 8.6% |
The United States shrimp market is considerably benefitting from the rollout of new food safety rules, especially after its regulatory partnership with Indonesia. This agreement mandates whole-genome sequencing for shrimp disease surveillance, aligning imported supply with stricter United States standards. The system improves traceability, giving importers and retailers higher certainty on product integrity. By mitigating food safety risks, stakeholders strengthen consumer confidence, particularly in retail and e-commerce channels where transparency is critical.
In October 2024, Walmart, in partnership with Omarsa and The Nature Conservancy, introduced the North Star Program, aimed at mainstreaming low-carbon shrimp for American households. The initiative emphasizes renewable energy adoption, deforestation-free feed, and reduced marine ingredient usage. Walmart’s decision to absorb higher costs of certified shrimp redefines supplier expectations and drives wider adoption of eco-friendly practices, widening the scope for United States shrimp market opportunities.
Americans increasingly seek protein sources that balance nutrition and affordability, without compromising gourmet preferences. As a result, the shrimp demand in the United States is surging because of its lean protein and low saturated fat profile. Despite nearly 90% of consumers eating seafood, only 19% meet the recommended twice-weekly intake, leaving high-growth potential. Shrimp’s omega-3 content further amplifies its appeal as diets shift away from red meat.
Domestic shrimp farming is gaining momentum in the United States shrimp market dynamics, powered by strategic investments and innovation. Trans American Aquaculture’s redevelopment of an 1,880-acre shrimp farm in Texas is a notable example. This facility is set to supply millions of pounds annually. Meanwhile, CP Foods’ Homegrown Shrimp USA in Florida operates land-based RAS farms producing antibiotic-free shrimp. Technological innovations like recirculating water systems enhance environmental efficiency while ensuring year-round production.
The imposition of tariffs between 10–46% on imported shrimp by the government has altered the United States shrimp market trends and dynamics. With Indian shrimp facing a 26% levy and Ecuadorian shipments at 15%, domestic players have gained significant opportunities for growth. These tariff shields are positively impacting aquaculture startups and existing producers to scale capacity.
Read more about this report - REQUEST FREE SAMPLE COPY IN PDF
The EMR’s report titled “United States Shrimp Market Report and Forecast 2026-2035” offers a detailed analysis of the market based on the following segments:
Market Breakup by Environment
Key Insight: Farming drives supply security, leveraging sustainable aquaculture practices and bio secure technologies to ensure stable domestic availability, largely impacting the United States shrimp market value. Processing complements the overall market growth by adding value, producing convenient and high-quality formats that appeal to consumers and institutional buyers alike. Other environments, such as distribution hubs and cold chain infrastructure, support efficient flow of shrimp from farms to tables.
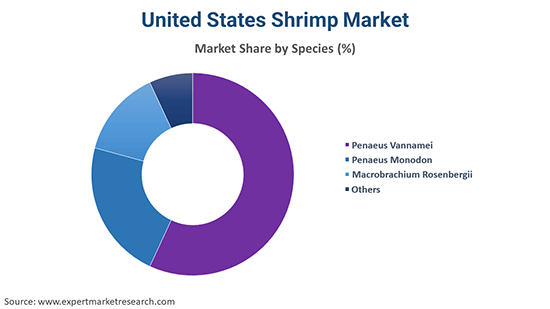
Market Breakup by Species
Key Insight: Penaeus Vannamei currently dominates the market through large-scale adaptability and affordability, securing the majority of shrimp supply. Penaeus monodon is experiencing accelerated growth, driven by upscale foodservice demand. Macrobrachium Rosenbergii (giant river prawn) attracts niche audiences for specialty dishes, valued for its distinct size and culinary applications.
Market Breakup by Product Categories
Key Insight: As per the United States shrimp market report, the peeled variant currently boasts dominance. These variants are valued for their ease of use and universal appeal. Breaded shrimp captures fast growth, capitalizing on quick-meal demand in frozen retail and casual dining. Shell-on shrimp holds niche appeal for traditional seafood consumers, while cooked shrimp provides ready-to-eat convenience for salads and appetizers.
Market Breakup by Distribution Channel
Key Insight: Distribution trends in the United States shrimp market, emphasize the strength of both traditional and modern sales models. Hotels and restaurants dominate with their ability to integrate shrimp into premium dining experiences. Supermarkets and hypermarkets continue to drive household purchases through bulk and variety offerings. Online stores are the fastest-growing category, fueled by digitization and consumer interest in convenience.
Market Breakup by Production and Imports
Key Insight: Imports dominate the market with massive supply capacity, competitive pricing, and product diversity from global leaders. Domestic production is growing rapidly, driven by federal support and consumer preference for traceable seafood. Each of these categories balance affordability with premium local supply. Imports guarantee volume stability, while domestic farms emphasize sustainability and freshness.
Market Breakup by Region
Key Insight: Regional trends highlight the dominance of the Southeast, rooted in strong aquaculture traditions and natural resource advantages. The Far West leads growth with its technology-driven indoor farming expansion. New England and the Mideast are advancing sustainable practices to meet urban demand, while the Great Lakes and Plains are exploring indoor aquaculture to diversify supply. The Southwest and Rocky Mountain regions contribute through targeted production and distribution capabilities. Each region’s distinct advantages collectively ensure the United States shrimp market remains resilient, adaptive, and aligned with both consumer demand and sustainability goals.
By environment, farming emerges to be the dominant category driven by rising aquaculture investments
Farming represents the core pillar of the United States shrimp industry, securing the dominant share due to advanced aquaculture adoption. Facilities in Texas and Florida are revitalizing large tracts of land into sustainable farms, utilizing recirculating aquaculture systems (RAS) to achieve bio secure production. Such models allow producers to meet consistent year-round demand while mitigating disease risks and reliance on imports. Shrimp farms like Trans American Aquaculture are scaling output to millions of pounds annually, directly feeding domestic consumption.
Processing environments are experiencing rapid growth in the United States shrimp market, driven by automation, enhanced food safety, and consumer preference for ready-to-cook shrimp. Processors are investing heavily in robotics and packaging innovations to reduce labor costs while meeting strict quality standards. Value-added products such as breaded shrimp, pre-cooked packs, and flavored varieties are expanding rapidly in both retail and foodservice.
By species, Penaeus Vannamei dominates the market with high farming efficiency and strong demand
Penaeus Vannamei, commonly called whiteleg shrimp, registers the largest share of the market, primarily because of its adaptability and disease resistance. Its fast growth cycle allows for large-scale, cost-efficient farming across diverse aquaculture environments. This makes it ideal for domestic producers investing in RAS and pond-based systems. Its mild taste and firm texture resonate well with both retail shoppers and foodservice operators, further securing its dominance in the United States shrimp market.
Penaeus Monodon, known as black tiger shrimp, is the fastest-growing species in the market. Its larger size and distinct flavor cater to premium retail and upscale dining. Growing consumer interest in differentiated seafood experiences is fueling its demand in specialty stores and restaurants. Imports from Southeast Asia are ensuring consistent availability, while the aquaculture industry is beginning to explore opportunities in controlled environments to supply niche markets.
By product category, peeled shrimp leads the market with convenience and versatility driving adoption
Peeled shrimp secures the dominant position in terms of the United States shrimp market revenue, supported by strong demand for convenience. With pre-deveined and shell-free formats, peeled shrimp minimizes preparation time, making it a staple in both retail kitchens and foodservice. Busy households prefer it for weeknight meals, while restaurants use it across diverse menus due to its consistent quality and ease of handling.
Breaded shrimp has emerged as the fastest-growing product category, thriving on consumer preference for snackable, ready-to-cook seafood. Popular in frozen aisles and quick-service restaurants, breaded shrimp aligns with the trend of convenient yet indulgent meal options. Its crispy texture and ease of preparation appeal strongly to younger, urban consumers with busy lifestyles. Retailers and processors are diversifying offerings with flavor-infused coatings and portion-controlled packs, further fueling demand in the United States shrimp market.
| CAGR 2026-2035 - Market by | Distribution Channel |
| Online Stores | 4.6% |
| Hypermarkets and Supermarkets | 2.4% |
| Convenience Stores | XX% |
| Hotels and Restaurants | XX% |
| Others | XX% |
By distribution channel, hotels and restaurants account for a substantial share of the market through premium foodservice demand
Hotels and restaurants largely drive the shrimp consumption in the United States, reflecting strong foodservice-driven demand. Shrimp’s reputation as a versatile premium protein makes it a consistent feature on menus across casual dining and upscale establishments. The sector benefits from consumer willingness to pay more for high-quality seafood experiences.
| 2025 Market Share by | Distribution Channel |
| Online Stores | 8.6% |
| Hypermarkets and Supermarkets | XX% |
| Convenience Stores | XX% |
| Hotels and Restaurants | XX% |
| Others | XX% |
Online channels are rapidly expanding their share in the market, reshaping how shrimp reaches consumers. The growth of digital payment systems, cold-chain logistics, and home delivery has normalized seafood e-commerce. Consumers are increasingly turning to platforms offering curated, traceable, and fresh shrimp delivered to their doorsteps, accelerating United States shrimp market opportunities. Retailers are enhancing trust by offering transparency around sourcing and sustainability certifications online. Subscription-based seafood boxes are also gaining traction.
Imports hold the largest market share with diverse global supply networks
Imports dominate the market, accounting for nearly 80–85% of supply. Major exporters like India, Ecuador, Vietnam, and Indonesia offer competitive pricing and variety, keeping shrimp widely accessible across retail and foodservice. Despite tariffs raising costs on certain imports, international suppliers remain indispensable for ensuring year-round availability. Imports provide diverse species, formats, and value-added products that meet evolving United States consumer preferences.
| CAGR 2026-2035 - Market by | Production and Imports |
| Domestic Production | 2.2% |
| Imports | XX% |
Domestic production observes fast growth. Innovative players like Atarraya Inc. in New Jersey are using recirculating aquaculture systems to produce sustainable shrimp locally. Domestic supply is appealing for traceability, freshness, and reduced carbon footprint, aligning with shifting consumer values. Louisiana, Texas, and Florida are central hubs where aquaculture is scaling capacity, boosting the opportunities for United States shrimp industry expansion.


Southeast clocks in the largest market Share with established aquaculture and shrimping tradition
The Southeast region, encompassing Louisiana, Texas, Alabama, and Florida, dominates the market due to strong aquaculture infrastructure and its proximity to the Gulf of Mexico. Louisiana alone contributes a significant portion of domestic shrimp production, backed by robust processing facilities and cultural traditions tied to shrimping.
The Far West, particularly California, is rapidly expanding as the fastest-growing regional shrimp market in the United States. Advanced indoor farming and RAS systems enable producers to operate year-round, independent of climate conditions. This appeals to environmentally conscious consumers seeking locally sourced shrimp with minimal ecological footprint. California’s tech-driven approach is fostering investment in sustainable aquaculture, supporting both small-scale startups and larger commercial operations.
The market is defined by intense competition among global importers, domestic aquaculture startups, and established processors. United States shrimp companies are focusing heavily on value-added product innovation, from ready-to-eat packs to seasoned frozen shrimp tailored for busy households and institutional buyers. Investments in cold chain logistics and advanced freezing technologies are improving product integrity across distribution channels. Sustainability certifications are becoming a competitive differentiator, with retailers demanding transparency on sourcing and carbon footprint reduction.
Strategic partnerships, such as Walmart’s North Star Program with global suppliers, highlight retail’s power in shaping supply standards. For United States shrimp market players, tariffs and federal funding are creating opportunities to scale production and gain share against imports. Consolidation is also a focus area, with mergers and acquisitions enabling firms to expand their geographic reach and strengthen portfolios. The competitive focus is shifting toward balancing scale, traceability, and innovation to capture evolving consumer and institutional demand.
Aqua Star, established in 1990 and headquartered in the United States is a major frozen seafood supplier serving retail and foodservice across North America. The company leverages cold-chain innovation and proprietary freezing techniques to extend shelf life and expand direct-to-retailer programs. Aqua Star is piloting blockchain traceability for select shrimp lines, enabling B2B buyers to verify sourcing and harvest conditions.
Harbor Seafood, established in 1975 and headquartered in New Hyde Park, New York, is a specialist seafood distributor focused on shellfish and value-added shrimp. The firm serves regional foodservice operators and institutional buyers through customized supply contracts and rapid regional logistics.
Eastern Fish Company, established in 1974 and headquartered in Teaneck, United States, is one of the nation’s largest shrimp importers and processors. The company emphasizes vertical integration and supplier partnerships to secure consistent quality volumes while piloting antibiotic-free sourcing programs. Eastern Fish is scaling automated grading and IQF freezing lines to serve large foodservice accounts reliably.
Mazzetta Company, LLC, established in 1987 and headquartered in Highland Park, Illinois, is a fully integrated importer and distributor of frozen seafood for retail and foodservice markets. Mazzetta differentiates with portion-controlled, chef-ready shrimp that reduces kitchen labor and improves yield for institutional buyers.
*Please note that this is only a partial list; the complete list of key players is available in the full report. Additionally, the list of key players can be customized to better suit your needs.*
Explore the latest trends shaping the United States shrimp market 2026-2035 with our in-depth report. Gain strategic insights, future forecasts, and key market developments that can help you stay competitive. Download a free sample report or contact our team for customized consultation on United States shrimp market trends 2026.
India Shrimp Feed Market
Europe Shrimp Market
India Shrimp Market
Shrimp Feed Market
Shrimp Market


Upto 15% Off
USD
$2499 $2249
$3999 $3599
$4999 $4249
$5999 $5099


*While we strive to always give you current and accurate information, the numbers depicted on the website are indicative and may differ from the actual numbers in the main report. At Expert Market Research, we aim to bring you the latest insights and trends in the market. Using our analyses and forecasts, stakeholders can understand the market dynamics, navigate challenges, and capitalize on opportunities to make data-driven strategic decisions.*
Get in touch with us for a customized solution tailored to your unique requirements and save upto 35%!
In 2025, the United States shrimp market reached an approximate volume of 846.90 KMT.
The market is projected to grow at a CAGR of 2.40% between 2026 and 2035.
The market is estimated to witness healthy growth in the forecast period of 2026-2035 to reach a volume of around 1073.57 KMT by 2035.
Scaling domestic RAS capacity, investing in blockchain traceability, diversifying supplier networks, piloting low-carbon feed trials, expanding cold-chain e-commerce logistics, partnering with retailers for private-label sustainability programs, and automating grading.
The key trends guiding the growth of the shrimp market in the United States include the rising health-consciousness among consumers and increasing demand for ready-to-eat shrimps.
Farming and processing are the various environment of shrimp in the market.
Penaeus vannamei, penaeus monodon, and macrobrachium rosenbergii are the different shrimp species in the market.
Peeled, shell -on, cooked, and breaded, among others, are the leading product categories in the market.
Hotels and restaurants, hypermarkets and supermarkets, convenience stores, and online stores, among others, are the various distribution channels in the shrimp market in the United States.
The key players in the market include Aqua Star, Harbor Seafood, Eastern Fish Company, Mazzetta Company LLC, among others.
The major regions include New England, Mideast, Great Lakes, Plains, Southeast, Southwest, Rocky Mountain, and Far West.
Supply volatility, tariff swings, disease outbreaks, rising feed and energy costs, and mounting traceability requirements are compressing margins while forcing firms to invest heavily in sustainability, compliance, and resilient supply chains.
Explore our key highlights of the report and gain a concise overview of key findings, trends, and actionable insights that will empower your strategic decisions.
| REPORT FEATURES | DETAILS |
| Base Year | 2025 |
| Historical Period | 2019-2025 |
| Forecast Period | 2026-2035 |
| Scope of the Report |
Historical and Forecast Trends, Industry Drivers and Constraints, Historical and Forecast Market Analysis by Segment:
|
| Breakup by Environment |
|
| Breakup by Species |
|
| Breakup by Product Category |
|
| Breakup by Distribution Channel |
|
| Breakup by Production and Imports |
|
| Breakup by Region |
|
| Market Dynamics |
|
| Competitive Landscape |
|
| Companies Covered |
|
| Report Price and Purchase Option | Explore our purchase options that are best suited to your resources and industry needs. |
| Delivery Format | Delivered as an attached PDF and Excel through email, with an option of receiving an editable PPT, according to the purchase option. |
Datasheet
One User
USD 2,499
USD 2,249
tax inclusive*
Single User License
One User
USD 3,999
USD 3,599
tax inclusive*
Five User License
Five User
USD 4,999
USD 4,249
tax inclusive*
Corporate License
Unlimited Users
USD 5,999
USD 5,099
tax inclusive*
*Please note that the prices mentioned below are starting prices for each bundle type. Kindly contact our team for further details.*
Flash Bundle
Small Business Bundle
Growth Bundle
Enterprise Bundle
*Please note that the prices mentioned below are starting prices for each bundle type. Kindly contact our team for further details.*
Flash Bundle
Number of Reports: 3
20%
tax inclusive*
Small Business Bundle
Number of Reports: 5
25%
tax inclusive*
Growth Bundle
Number of Reports: 8
30%
tax inclusive*
Enterprise Bundle
Number of Reports: 10
35%
tax inclusive*
How To Order

Select License Type
Choose the right license for your needs and access rights.

Click on ‘Buy Now’
Add the report to your cart with one click and proceed to register.

Select Mode of Payment
Choose a payment option for a secure checkout. You will be redirected accordingly.
Gain insights to stay ahead and seize opportunities.

Get insights & trends for a competitive edge.

Track prices with detailed trend reports.

Analyse trade data for supply chain insights.

Leverage cost reports for smart savings

Enhance supply chain with partnerships.

Connect For More Information
Our expert team of analysts will offer full support and resolve any queries regarding the report, before and after the purchase.
Our expert team of analysts will offer full support and resolve any queries regarding the report, before and after the purchase.
We employ meticulous research methods, blending advanced analytics and expert insights to deliver accurate, actionable industry intelligence, staying ahead of competitors.
Our skilled analysts offer unparalleled competitive advantage with detailed insights on current and emerging markets, ensuring your strategic edge.
We offer an in-depth yet simplified presentation of industry insights and analysis to meet your specific requirements effectively.


Share