

Consumer Insights
Uncover trends and behaviors shaping consumer choices today
Procurement Insights
Optimize your sourcing strategy with key market data
Industry Stats
Stay ahead with the latest trends and market analysis.

The United States engine driven welders market attained a value of USD 412.64 Million in 2025. The market is estimated to grow at a CAGR of 3.60% during 2026-2035 to reach a value of USD 587.72 Million by 2035.
Base Year
Historical Period
Forecast Period
Reportedly, the United States 117th Congress invested over USD 120 billion in U.S. infrastructure, between 2021 and 2023.
In 2023, 5.2 billion cubic feet per day (Bcf/d) of natural gas intrastate pipeline capacity was assembled in the US. The expansion of the pipeline sector is adding to the demand for engine driven welders.
In 2023, private sector construction spending constituted USD 1.5 trillion, growing by 4.7% over the previous year, thus providing a positive outlook for the market.
Compound Annual Growth Rate
3.6%
Value in USD Million
2026-2035
*this image is indicative*
| United States Engine Driven Welders Market Report Summary | Description | Value |
| Base Year | USD Million | 2025 |
| Historical Period | USD Million | 2019-2025 |
| Forecast Period | USD Million | 2026-2035 |
| Market Size 2025 | USD Million | 412.64 |
| Market Size 2035 | USD Million | 587.72 |
| CAGR 2019-2025 | Percentage | XX% |
| CAGR 2026-2035 | Percentage | 3.60% |
| CAGR 2026-2035 - Market by Country | Southwest | 4.4% |
| CAGR 2026-2035 - Market by Country | Rocky Mountain | 4.2% |
| CAGR 2026-2035 - Market by Fuel Type | Gasoline Engine | 4.1% |
| CAGR 2026-2035 - Market by Alcohol Content | Construction | 4.1% |
| Market Share by Country 2025 | Southeast | 22.9% |
The ability of engine driven welders to carry out multiple tasks saves money and space while helping in completing work efficiently. The portability of engine driven welders is allowing for more flexibility in the construction operations, particularly in large scale infrastructure projects, where the work is to be carried out in hard to reach or remote locations. The construction sector in the United States has been growing significantly owing to the presence of government initiatives such as the Infrastructure Investment and Jobs Act (IIJA), Inflation Reduction Act (IRA), and CHIPS Act. The expansion of the infrastructure sector is favouring the growth of the United States engine driven welders market.
Figure: Mineral Production (USD Billion) of top 10 Mineral Producing States in the USA, 2022
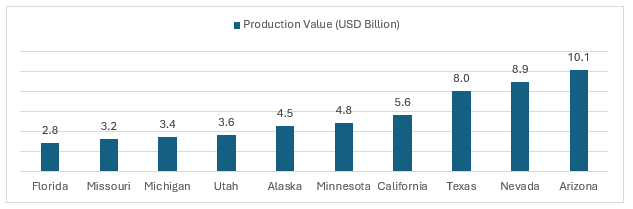
Arizona is the largest mineral-producing state, accounting for 10.3% of the total minerals produced in the USA in 2022. The most mined commodity in the USA is coal. In 2022, around 594 million short tons of coal were produced in 21 U.S. states. Further, surface mines were the source of 63% of total U.S. coal production, accounting for 65% of the total number of producing mines.
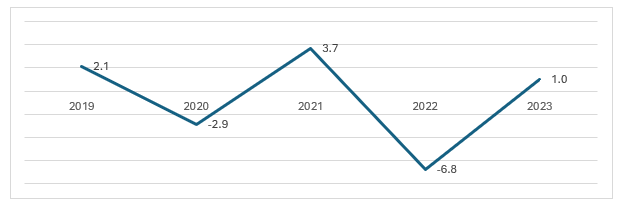
Figure: Real Gross Domestic Product: Construction (23) in the United States, Percent Change from 2023, Annual, Seasonally Adjusted Annual Rate
In 2023, crushed stone was the leading non-fuel mineral commodity produced in the USA, accounting for 23% of the total value of U.S. mine production. U.S. mineral production contributed over USD 105 billion to the U.S. economy in 2023, a rise of USD 4 billion over 2022. Welding techniques are commonly used in the mining industry for metal fabrication purposes, supporting the United States engine driven welders market development. Machine driven welding offers increased efficiency, longevity, and productivity.
The United States is witnessing a significant growth in construction activity, marking a prominent phase of economic growth and industrial expansion. During Q1 2024, the construction spending in the United States amounted to USD 635.5 billion, representing an increase of 10.9% from USD 573.0 billion for the same period in 2023.
In 2023, the total spending in construction reached USD 1.98 trillion, marking a 7.4% increase from 2022. The construction sector in the United States accounts for about 4.3% of U.S. GDP.
Expanding construction sector; growing mining sector; rising establishment of pipelines; and growing technological advancements are the key trends impacting the United States engine driven welders market growth
Engine driven welding plays a crucial role in the construction sector by generating power for arc welding and cutting. In 2023, the construction sector contributed 4.3% to the U.S. GDP, increasing from 4.0% in 2022.
Mining equipment, including towering cranes and intricate machinery, must have high structural integrity and offer precision and efficiency. Welding machines are essential for constructing these machines, ensuring their performance and durability. Key commodities mined in the USA are coal, copper, lithium, and gold.
The United States boasts one of the world’s extensive oil and gas pipeline networks, with several new pipeline plans. The 2021 infrastructure law provides USD 550 billion for 2022-2026 in investment for pipeline safety and repair, infrastructure, including in roads, bridges, etc.
The development of technologies to decrease the engine driven welder’s fuel usage and lower operating costs, supports the United States engine driven welders market expansion. Technological advancements have aided the development of machines that can automatically respond to the weld requirements and adjust their engine speed to one of several rpm levels.
The USA’s nation-leading goals under the Climate Act aim at achieving 70% renewably sourced electricity by 2030 and a zero-emission electric grid by 2040. These aggressive targets are acting as a powerful catalyst for the renewable energy sector and the use of engine driven welders. The expansion of renewable energy capacity necessitates the development and upgrading of transmission and distribution networks. Welding is indispensable in the construction of power transmission towers, and substations. The manufacturing and assembly of solar panels and wind turbines involve complex welding processes for the frames, mounting structures, and nacelles. Welding aids in producing energy storage systems, from assembling battery cells to fabricating housings and connectors.
Further, the integration of electronic fuel injection (EFI) technology in engine driven welders provides faster and more-reliable starts in any weather with greater fuel efficiency compared to conventional machines.
“United States Engine Driven Welders Market Report and Forecast 2026-2035” offers a detailed analysis of the market based on the following segments:
Market Breakup by Fuel Type
Market Breakup by Welding Current
Market Breakup by Application
Market Breakup by Region
| CAGR 2026-2035 - Market by | Fuel Type |
| Gasoline Engine | 4.1% |
| Diesel Engine | XX% |
| Others | XX% |
| CAGR 2026-2035 - Market by | Application |
| Construction | 4.1% |
| Power Generation | 3.4% |
| Mining | XX% |
| Infrastructure | XX% |
| Pipeline | XX% |
| Others | XX% |
| CAGR 2026-2035 - Market by | Region |
| Southwest | 4.4% |
| Rocky Mountain | 4.2% |
| New England | 3.4% |
| Great Lakes | 3.0% |
| Mideast | XX% |
| Plains | XX% |
| Southeast | XX% |
| Far West | XX% |
Based on application, the infrastructure sector accounts for a significant share of the United States engine driven welders market
During 2021-2023, USD 70.2 billion investments were made to develop roads, bridges, and major projects. This initiative was part of the Bipartisan Infrastructure Law passed in 2021. The law allocates USD 1.2 trillion in federal funds to transportation, energy, and climate infrastructure projects, primarily through state and local governments. Ageing infrastructure and increasing investment in clean energy and power infrastructure support the market growth. During 2021-2023, USD 5.5 billion infrastructure investment was made in USA.
| Market Share by | Region |
| Southeast | 22.9% |
| New England | XX% |
| Mideast | XX% |
Residential spending constitutes approx. 45% of the total construction spending in the United States in 2023, growing at a CAGR of 9% between 2018 and 2023. During the same period, the construction spending within the manufacturing sector grew at a CAGR of 22%, thus, providing significant opportunity in the market.
Based on fuel type, diesel engine is a major contributor to the United States engine driven welders market revenue
Diesel-powered engine driven welders provides higher fuel efficiency along with longer lifespan, which is increasing their popularity among end users. They are being incorporated with technologies like reduced control cables, variable engine RPM, auto-stop/start technology, among others, which improves the fuel efficiency and reduce emissions.
Gasoline-powered engine driven welders are mostly preferred for mobile fabrication, owing to their compact size and thus finds increasing popularity within the agricultural industry. In 2022, farm improvements and construction expenditure accounted for 4.2% of the total farm expenditure and reached USD 19.0 billion.
The market players are focusing on providing products at competitive prices and high quality, with improved customer service, product support, and performance features.
Lincoln Electric leads in arc welding solutions, automated systems, cutting equipment, and alloys, advancing fabrication capabilities with superior expertise. Headquartered in the US, the company serves customers across various sectors, including metal fabrication, energy, construction, infrastructure, heavy industries, and automotive/transportation.
Miller Electric Mfg. LLC is a subsidiary of Illinois Tool Works, Inc. (“ITW”). Founded in 1929, the company develops innovative welding solutions, addressing challenges in manufacturing, fabrication, construction, aviation, motorsports, education, agriculture, marine applications, and more, to seek the highest quality equipment to perform their best work.
Denyo business lines include the manufacturing and sales of engine driven generators, welders, air compressors, and other specialized machinery. Denyo operates across various plants including Fukui, Shiga, Karatsu (Japan), Kentucky (U.S.A.), Indonesia and Vietnam with a workforce of 596 employees.
Multiquip, based in the United States, is a leading, diversified manufacturer and supplier of high-quality products and solutions for various markets, including light construction equipment, power generators, lighting, and others.
*Please note that this is only a partial list; the complete list of key players is available in the full report. Additionally, the list of key players can be customized to better suit your needs.*
Other notable players operating in the United States engine driven welders market are ESAB Corporation, and Tomahawk Power LLC, among others.


The states of California, Florida, and New York boast the largest number of construction businesses in the U.S., which creates demand for engine driven welders for productivity gain.
The growing infrastructure spending is expected to improve the Alabama’s attractiveness which is supplemented by the five-year Infrastructure Investment and Jobs Act (IIJA), signed into law in November 2021, that will provide $5.5 billion for highway and bridge investments, including a 37% funding increase over the first three years of the program from FY 2022 to FY 2024. Further, the growing investment in the natural gas infrastructure is expected to further uptick the market.
Engine driven welders find increasing application in mining and oil and gas sector in the south west region. In 2023, production of crude oil and condensate reached 1.92 billion barrels in Texas, which witnessed an increase of 51 million barrels, as compared to 2022., thus, aiding the market. Further, the growing population and economy in the U.S. Southwest is translating into an increased demand for building design and construction.


Upto 15% Off
USD
$2499 $2249
$3999 $3599
$4999 $4249
$5999 $5099


*While we strive to always give you current and accurate information, the numbers depicted on the website are indicative and may differ from the actual numbers in the main report. At Expert Market Research, we aim to bring you the latest insights and trends in the market. Using our analyses and forecasts, stakeholders can understand the market dynamics, navigate challenges, and capitalize on opportunities to make data-driven strategic decisions.*
Get in touch with us for a customized solution tailored to your unique requirements and save upto 35%!
The United States market for engine driven welders reached a value of USD 412.64 Million in 2025.
The market is estimated to grow at a CAGR of 3.60% during 2026-2035.
The market is estimated to witness a healthy growth in the forecast period of 2026-2035 to reach a value of USD 587.72 Million by 2035.
The factors driving the market growth are increasing technological advancements, rising construction and infrastructure development activities, expansion of the pipeline sector, etc.
The key regional markets for engine driven welders are New England, Mideast, Great Lakes, Plains, Southeast, Southwest, Rocky Mountain, and Far West.
The end uses include construction, infrastructure, pipeline, mining, and power generation, among others.
The welding currents are 300-500 amp, less than 300 amp, above 500 amp.
The key players in the market include Lincoln Electric Holdings Inc, Miller Electric Mfg. LLC, Denyo Co. Ltd, Multiquip Inc, ESAB Corporation, and Tomahawk Power LLC, among others.
Explore our key highlights of the report and gain a concise overview of key findings, trends, and actionable insights that will empower your strategic decisions.
| EPORT FEATURES | DETAILS |
| Base Year | 2025 |
| Historical Period | 2019-2025 |
| Forecast Period | 2026-2035 |
| Scope of the Report |
Historical and Forecast Trends, Industry Drivers and Constraints, Historical and Forecast Market Analysis by Segment:
|
| Breakup by Fuel Type |
|
| Breakup by Welding Current |
|
| Breakup by Application |
|
| Breakup by Region |
|
| Market Dynamics |
|
| Competitive Landscape |
|
| Companies Covered |
|
Datasheet
One User
USD 2,499
USD 2,249
tax inclusive*
Single User License
One User
USD 3,999
USD 3,599
tax inclusive*
Five User License
Five User
USD 4,999
USD 4,249
tax inclusive*
Corporate License
Unlimited Users
USD 5,999
USD 5,099
tax inclusive*
*Please note that the prices mentioned below are starting prices for each bundle type. Kindly contact our team for further details.*
Flash Bundle
Small Business Bundle
Growth Bundle
Enterprise Bundle
*Please note that the prices mentioned below are starting prices for each bundle type. Kindly contact our team for further details.*
Flash Bundle
Number of Reports: 3
20%
tax inclusive*
Small Business Bundle
Number of Reports: 5
25%
tax inclusive*
Growth Bundle
Number of Reports: 8
30%
tax inclusive*
Enterprise Bundle
Number of Reports: 10
35%
tax inclusive*
How To Order

Select License Type
Choose the right license for your needs and access rights.

Click on ‘Buy Now’
Add the report to your cart with one click and proceed to register.

Select Mode of Payment
Choose a payment option for a secure checkout. You will be redirected accordingly.
Gain insights to stay ahead and seize opportunities.

Get insights & trends for a competitive edge.

Track prices with detailed trend reports.

Analyse trade data for supply chain insights.

Leverage cost reports for smart savings

Enhance supply chain with partnerships.

Connect For More Information
Our expert team of analysts will offer full support and resolve any queries regarding the report, before and after the purchase.
Our expert team of analysts will offer full support and resolve any queries regarding the report, before and after the purchase.
We employ meticulous research methods, blending advanced analytics and expert insights to deliver accurate, actionable industry intelligence, staying ahead of competitors.
Our skilled analysts offer unparalleled competitive advantage with detailed insights on current and emerging markets, ensuring your strategic edge.
We offer an in-depth yet simplified presentation of industry insights and analysis to meet your specific requirements effectively.


Share