

Consumer Insights
Uncover trends and behaviors shaping consumer choices today
Procurement Insights
Optimize your sourcing strategy with key market data
Industry Stats
Stay ahead with the latest trends and market analysis.
Trending Now


The United States citric acid market attained a volume of 607.90 KMT in 2024. The market is estimated to grow at a CAGR of 2.80% during 2025-2034 to reach a volume of 801.24 KMT by 2034.
Base Year
Historical Year
Forecast Year
Corn is the most commonly used substrate in the production of citric acid in the U.S. In 2023, the U.S. produced 15.3 billion bushels of corn compared to 13.7 billion bushels in 2022.
In 2022, the U.S. accounted for 42.6% of the pharmaceutical manufacturing globally.
As of July 2024, consumers in the U.S. spend USD 89.7 billion on beauty products annually.


Value in KMT
2025-2034
United States Citric Acid Market Outlook
*this image is indicative*
| United States Citric Acid Market Report Summary | Description | Value |
| Base Year | KMT | 2024 |
| Historical Period | KMT | 2018-2024 |
| Forecast Period | KMT | 2025-2034 |
| Market Size 2024 | KMT | 607.90 |
| Market Size 2034 | KMT | 801.24 |
| CAGR 2018-2024 | Percentage | XX% |
| CAGR 2025-2034 | Percentage | 2.80% |
| CAGR 2025-2034 - Market by Region | Southwest | 3.6% |
| CAGR 2025-2034 - Market by Region | Rocky Mountain | 3.2% |
| CAGR 2025-2034 - Monohydrate Market by by End Use | Pharmaceuticals | 3.6% |
| CAGR 2025-2034 - Anhydrous Market by End Use | Pharmaceuticals | 7.0% |
| Market Share by Region | Southwest | 15.2% |
Following Europe, the United States is deemed as the largest producer of citric acid on a global scale. The key substrate used in the A. Niger citric acid sector is corn steep liquor. In the United States, over 90% of the citric acid manufacturers rely on the fermentation of corn-derived glucose or dextrose. In 2023, the United States produced 15.3 billion bushels of corn.
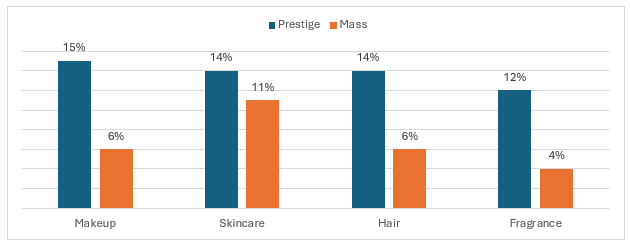
In the personal care sector, citric acid finds application as a pH adjuster, clarifying agent, and water softener. The chelating agent in citric acid plays a role in removing hard water ions, improving the lathering and foaming characteristics of personal care products. It is also used to preserve the colour and fragrance compounds in toiletries and perfumes. In 2023, the mass market beauty sales experienced a year-over-year dollar increase of 6% and the luxury beauty segment sales reached USD 31.7 billion, growing by 14% y-o-y.
Figure: Y-o-Y % Change Based on Sales Revenue in U.S. Beauty and Personal Care Sector by Category, 2023
Expansion of the food and beverages sector; growing demand for cleaning products; rising use in pharmaceutical applications; and consumer demand for organic preservatives are the key trends impacting the citric acid market growth
The food industry uses citric acid as a preservative in packaged, jarred, processed, and canned food to extend its shelf life. As of 2024, the USA’s food and beverage sector accounts for 5% of the country’s GDP.
Synthetic phosphates in detergents pose risks to human, animal, and environmental health. States like Illinois, Indiana, Maryland, and Massachusetts have banned high-phosphate dishwasher detergents. This provides an opportunity for citric acid in the detergent industry to replace phosphate due to its lower eutrophic effect.
Citric acid enhances flavor in medicines and syrups, reduces bitterness, and serves as a pH adjustor and stabilizer. As of 2024, the USA is the largest pharmaceutical manufacturing nation in the world, producing medicines worth USD 516 billion.
Citric acid is considered a key organic acid extensively used in the food and beverage sector. Customers are increasingly on the lookout for healthier and more sustainable options. As of 2023, it is reported that about 6% of the total food sales in the United States is composed of organic foods. Additionally, in 2022, organic beverages in the United States reported USD 9 billion in sales, an increase of 4% from 2021.
The Food and Drug Administration (FDA) has recognized citric acid as safe and is permitted its use in the food manufacturing sector according to the current GMP without setting an upper limit. The production of citric acid by recovery from sources such as lemon or pineapple juice, by mycological fermentation using Candida spp, and by the solvent extraction process for the recovery of citric acid from Aspergillus niger fermentation liquor is affirmed by the FDA, significantly increasing its adoption in food and beverages, pharmaceuticals and personal care sectors.
The rising prioritisation of wellness and personal care among the American population is driving the adoption of beauty and personal care products. The United States is among the top producers of beauty products on a global scale. In 2023, American customers spent USD 94.36 billion on beauty and cosmetics. In the skincare formulations, citric acid acts as a protective antioxidant and provides corrective antiaging effects helping reverse the signs of photodamage. Moreover, it exfoliates the upper layer of dead skin cells aiding in cleaning pores and softening the skin.


“United States Citric Acid Market Report and Forecast 2025-2034” offers a detailed analysis of the market based on the following segments:
Market Breakup by Form:
Market Breakup by Region:
| CAGR 2025-2034 - Monohydrate Market by | End Use |
| Pharmaceuticals | 3.6% |
| Food and Beverages | 2.5% |
| Household Detergents and Cleaners | XX% |
| Others | XX% |
| CAGR 2025-2034 - Anhydrous Market by | End Use |
| Pharmaceuticals | 7.0% |
| Food and Beverages | XX% |
| Household Detergents and Cleaners | XX% |
| Others | XX% |
| CAGR 2025-2034 - Market by | Region |
| Southwest | 3.6% |
| Rocky Mountain | 3.2% |
| Plains | 3.0% |
| Mideast | 2.6% |
| New England | XX% |
| Great Lakes | XX% |
| Southeast | XX% |
| Far West | XX% |
| Market Share by | Region |
| Southwest | 15.2% |
| New England | XX% |
| Mideast | XX% |
| Great Lakes | XX% |
Based on form, anhydrous accounts for a significant share of the market
The anhydrous form of citric acid is odorless, has a sour taste, and appears as a white crystalline solid. According to the FDA Select Committee on Generally Recognized as Safe (GRAS) food substances, citrate salts, including citric acid, are deemed safe when used in normal quantities, leading to their widespread use in food and beverages.
Citric acid monohydrate is a colourless liquid that is completely miscible in water. The USP food grade ingredients such as citric acid in the United States is manufactured as per strict quality standards to ensure purity, consistency, and safety for incorporation in food and beverages.
The market players are focused on offering products at competitive prices and high quality, with improved customer services.
Cargill is a global leader in providing food, ingredients, agricultural solutions, and industrial products. Founded in 1865, the company sells ingredients, finished solutions, and services to manufacturers, food service customers, and retailers. Cargill operates in 70 countries, with a workforce of over 160,000 employees worldwide.
ADM is a global leader in the nutrition industry. The company transforms natural products into essential foods, renewable industrial products, and a wide array of food and beverage ingredients. Founded in 1902, ADM operates on six continents, including North America, South America, Europe, Asia Pacific, the Middle East, and Africa, with a workforce of 42,000 employees.
Headquartered in the UK, Tate & Lyle is a leading specialty food and beverage solutions business renowned globally for its expertise in sweetening, mouthfeel, and fortification. The company operates in 121 countries, maintains 58 plants, offices, and Customer Innovation and Collaboration Centres, with a workforce of 3,318 employees.
Jungbunzlauer specializes in biodegradable key ingredients of natural origin and is one of the world's leading producers in this field. Their extensive portfolio includes citrics, gluconates, lactics, special salts, biogums, and other products. Headquartered in Switzerland, Jungbunzlauer serves customers in more than 130 countries, supported by a workforce of over 1,300 employees worldwide.
*Please note that this is only a partial list; the complete list of key players is available in the full report. Additionally, the list of key players can be customized to better suit your needs.*
Other notable players operating in the United States citric acid market are MP Biomedicals, LLC, and Hawkins, Inc, among others.
As of 2022, California had the presence of 16,576 life sciences establishments, significantly supporting the market. Additionally, California is home to a large number of food and beverage manufacturing plants of 6,301 (As of 2021), increasing the use of citric acid as a flavouring agent and preservative.
In September 2022, Oklahoma’s plans to become a national pharmaceutical manufacturing hub were strengthened by a USD 35 million federal Economic Development Administration grant, supporting the market for citric acid. In 2021, Texas had the presence of 2,782 food and beverage manufacturing plants.
United States Citric Acid Market Size
United States Citric Acid Market Growth
United States Citric Acid Market Trends
United States Citric Acid Market Share
*While we strive to always give you current and accurate information, the numbers depicted on the website are indicative and may differ from the actual numbers in the main report. At Expert Market Research, we aim to bring you the latest insights and trends in the market. Using our analyses and forecasts, stakeholders can understand the market dynamics, navigate challenges, and capitalize on opportunities to make data-driven strategic decisions.*
Get in touch with us for a customized solution tailored to your unique requirements and save upto 35%!
The market is estimated to grow at a CAGR of 2.80% during 2025-2034.
The factors driving the market are the increasing inclination towards organic preservatives, expansion of the food and beverage sector, growing adoption of personal care products, and significant demand for household detergents resulted by the increased importance of health and wellbeing.
The key trends of the market are increasing use in food and beverage industry, government initiatives, and research and development activities.
Citric acid is a colourless and odourless organic compound that has a sour taste and occurs naturally in citrus fruits.
The chemical formula for citric acid is C6H8O7.
The United States citric acid market is segmented based on form and region.
Drinking pure citric acid can cause allergic skin reactions, serious eye damage, skin irritations, eye irritations, and nose and throat irritations.
The US citric acid market attained a volume of 607.90 KMT in 2024.
The market is estimated to witness a healthy growth in the forecast period of 2025-2034 to reach a volume of 801.24 KMT by 2034.
The key regional markets are New England, Mideast, Great Lakes, Plains, Southeast, Southwest, Rocky Mountain, and Far West.
The applications include food and beverages, household detergents and cleaners, pharmaceuticals, and others.
The applications of monohydrate citric acid include food and beverages, pharmaceuticals, personal care, agriculture, and others.
The key players in the market include Cargill, Incorporated, Archer Daniels Midland Company, Tate & Lyle PLC, Jungbunzlauer Suisse AG, MP Biomedicals, LLC, and Hawkins, Inc, among others.
Explore our key highlights of the report and gain a concise overview of key findings, trends, and actionable insights that will empower your strategic decisions.
| REPORT FEATURES | DETAILS |
| Base Year | 2024 |
| Historical Period | 2018-2024 |
| Forecast Period | 2025-2034 |
| Scope of the Report |
Historical and Forecast Trends, Industry Drivers and Constraints, Historical and Forecast Market Analysis by Segment:
|
| Breakup by Form |
|
| Breakup by Region |
|
| Market Dynamics |
|
| Trade Data Analysis |
|
| Competitive Landscape |
|
| Companies Covered |
|
Datasheet
One User
USD 2,999
USD 2,699
tax inclusive*
Single User License
One User
USD 4,399
USD 3,959
tax inclusive*
Five User License
Five User
USD 5,599
USD 4,759
tax inclusive*
Corporate License
Unlimited Users
USD 6,659
USD 5,660
tax inclusive*
*Please note that the prices mentioned below are starting prices for each bundle type. Kindly contact our team for further details.*
Flash Bundle
Small Business Bundle
Growth Bundle
Enterprise Bundle
*Please note that the prices mentioned below are starting prices for each bundle type. Kindly contact our team for further details.*
Flash Bundle
Number of Reports: 3
20%
tax inclusive*
Small Business Bundle
Number of Reports: 5
25%
tax inclusive*
Growth Bundle
Number of Reports: 8
30%
tax inclusive*
Enterprise Bundle
Number of Reports: 10
35%
tax inclusive*
How To Order
Our step-by-step guide will help you select, purchase, and access your reports swiftly, ensuring you get the information that drives your decisions, right when you need it.

Select License Type
Choose the right license for your needs and access rights.

Click on ‘Buy Now’
Add the report to your cart with one click and proceed to register.

Select Mode of Payment
Choose a payment option for a secure checkout. You will be redirected accordingly.
Gain insights to stay ahead and seize opportunities.

Get insights & trends for a competitive edge.

Track prices with detailed trend reports.

Analyse trade data for supply chain insights.

Leverage cost reports for smart savings

Enhance supply chain with partnerships.

Connect For More Information
Our expert team of analysts will offer full support and resolve any queries regarding the report, before and after the purchase.
Our expert team of analysts will offer full support and resolve any queries regarding the report, before and after the purchase.
We employ meticulous research methods, blending advanced analytics and expert insights to deliver accurate, actionable industry intelligence, staying ahead of competitors.
Our skilled analysts offer unparalleled competitive advantage with detailed insights on current and emerging markets, ensuring your strategic edge.
We offer an in-depth yet simplified presentation of industry insights and analysis to meet your specific requirements effectively.
Australia
63 Fiona Drive, Tamworth, NSW
+61-448-061-727
India
C130 Sector 2 Noida, Uttar Pradesh 201301
+91-723-689-1189
Philippines
40th Floor, PBCom Tower, 6795 Ayala Avenue Cor V.A Rufino St. Makati City,1226.
+63-287-899-028, +63-967-048-3306
United Kingdom
6 Gardner Place, Becketts Close, Feltham TW14 0BX, Greater London
+44-753-713-2163
United States
30 North Gould Street, Sheridan, WY 82801
+1-415-325-5166
Vietnam
193/26/4 St.no.6, Ward Binh Hung Hoa, Binh Tan District, Ho Chi Minh City
+84-865-399-124
United States (Head Office)
30 North Gould Street, Sheridan, WY 82801
+1-415-325-5166
Australia
63 Fiona Drive, Tamworth, NSW
+61-448-061-727
India
C130 Sector 2 Noida, Uttar Pradesh 201301
+91-723-689-1189
Philippines
40th Floor, PBCom Tower, 6795 Ayala Avenue Cor V.A Rufino St. Makati City, 1226.
+63-287-899-028, +63-967-048-3306
United Kingdom
6 Gardner Place, Becketts Close, Feltham TW14 0BX, Greater London
+44-753-713-2163
Vietnam
193/26/4 St.no.6, Ward Binh Hung Hoa, Binh Tan District, Ho Chi Minh City
+84-865-399-124


Share