

Consumer Insights
Uncover trends and behaviors shaping consumer choices today
Procurement Insights
Optimize your sourcing strategy with key market data
Industry Stats
Stay ahead with the latest trends and market analysis.
Trending Now


The United States augmented and virtual reality market size reached a value of approximately USD 10.46 Billion in 2024. The market is further expected to grow at a CAGR of 27.60% between 2025 and 2034, reaching a value of around USD 119.68 Billion by 2034.
Base Year
Historical Year
Forecast Year


Value in USD Billion
2025-2034
United States Augmented and Virtual Reality Market Outlook
*this image is indicative*
Augmented reality (AR) is a system that combines real and virtual environments, enabling real-time interaction, and accurate 3D representation of real and virtual elements. On the other hand, virtual reality (VR) uses computer technology to build an entirely simulated environment that provides consumers a realistic experience.
Read more about this report - REQUEST FREE SAMPLE COPY IN PDF


The EMR’s report titled “United States Augmented and Virtual Reality Market Report and Forecast 2025-2034” offers a detailed analysis of the market based on the following segments:
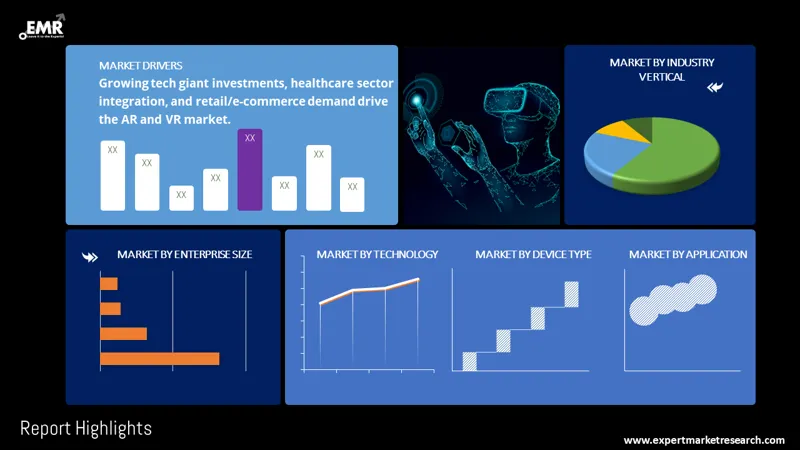
Market Breakup by Technology
Market Breakup by Device Type
Market Breakup by Enterprise Size
Market Breakup by Application
Market Breakup by Industry Vertical
Market Breakup by Region
Read more about this report - REQUEST FREE SAMPLE COPY IN PDF
The gaming segment witnessed significant growth in the United States augmented and virtual reality market, by industry vertical, supported by the expansion of the gaming industry and increase in number of gamers. Game creators can create more intricate and intriguing game worlds with AR and VR, giving players a more varied and engaging experience. The usage of AR and VR technologies also makes it possible for players to play games more conveniently and in different settings, thus increasing the demand for AR and VR in gaming.
The comprehensive EMR report provides an in-depth assessment of the market based on the Porter's five forces model, along with giving a SWOT analysis. The report gives a detailed analysis of the following key players in the United States augmented and virtual reality market, covering their competitive landscape and the latest developments like mergers, acquisitions, investments, and expansion plans.
Google LLC, founded in 1998 and headquartered in California in the United States, is an American global technology corporation. The focus of the company is on internet-related goods and services, such as online advertising technologies, cloud computing, software, and hardware.
Apple Inc., established in 1976 and based in California in the United States is an American multinational technology company. Well-known for its range of smartphones, tablets, and laptop computers, Apple creates, develops, and markets consumer goods, computer software, and internet services.
*Please note that this is only a partial list; the complete list of key players is available in the full report. Additionally, the list of key players can be customized to better suit your needs.*
Other market players include Meta Platforms, Inc., Microsoft Corporation, HTC Corporation, OpenArc, iTechArt Group, Inc., Intel Corporation, Magic Leap, Inc., and Sony Corporation, among others.
*While we strive to always give you current and accurate information, the numbers depicted on the website are indicative and may differ from the actual numbers in the main report. At Expert Market Research, we aim to bring you the latest insights and trends in the market. Using our analyses and forecasts, stakeholders can understand the market dynamics, navigate challenges, and capitalize on opportunities to make data-driven strategic decisions.*
Get in touch with us for a customized solution tailored to your unique requirements and save upto 35%!
In 2024, the United States market for augmented and virtual reality attained a value of USD 10.46 Billion.
The market is projected to grow at a CAGR of 27.60% between 2025 and 2034.
The market is estimated to witness a healthy growth in the forecast period of 2025-2034, reaching a value of around USD 119.68 Billion by 2034.
The major drivers of the market include the rising investments by tech giants for the adoption of AR and VR, increasing use of augmented and virtual reality in the healthcare sector, and growing demand for AR/VR in the retail and e-commerce industry.
Increasing adoption of AR and VR solutions in education, advancements in technology, and growing demand for head-mounted displays (HMDs) in gaming and entertainment are the key trends propelling the growth of the market.
The major regions in the market are New England, Mideast, Great Lakes, Plains, Southeast, Southwest, Rocky Mountain, and Far West.
The various industry verticals in the augmented and virtual reality market in the United States are gaming, entertainment and sports, aerospace and defence, healthcare, education, manufacturing, retail, and automotive, among others.
The major players in the United States augmented and virtual reality market, according to the report, are Google LLC, Apple Inc., Meta Platforms, Inc., Microsoft Corporation, HTC Corporation, OpenArc, iTechArt Group,Inc., Intel Corporation, Magic Leap, Inc., and Sony Corporation, among others.
Explore our key highlights of the report and gain a concise overview of key findings, trends, and actionable insights that will empower your strategic decisions.
| REPORT FEATURES | DETAILS |
| Base Year | 2024 |
| Historical Period | 2018-2024 |
| Forecast Period | 2025-2034 |
| Scope of the Report |
Historical and Forecast Trends, Industry Drivers and Constraints, Historical and Forecast Market Analysis by Segment:
|
| Breakup by Technology |
|
| Breakup by Device Type |
|
| Breakup by Enterprise Size |
|
| Breakup by Application |
|
| Breakup by Industry Vertical |
|
| Breakup by Region |
|
| Market Dynamics |
|
| Competitive Landscape |
|
| Companies Covered |
|
Single User License
One User
USD 3,999
USD 3,599
tax inclusive*
Datasheet
One User
USD 2,499
USD 2,249
tax inclusive*
Five User License
Five User
USD 4,999
USD 4,249
tax inclusive*
Corporate License
Unlimited Users
USD 5,999
USD 5,099
tax inclusive*
*Please note that the prices mentioned below are starting prices for each bundle type. Kindly contact our team for further details.*
Flash Bundle
Small Business Bundle
Growth Bundle
Enterprise Bundle
*Please note that the prices mentioned below are starting prices for each bundle type. Kindly contact our team for further details.*
Flash Bundle
Number of Reports: 3
20%
tax inclusive*
Small Business Bundle
Number of Reports: 5
25%
tax inclusive*
Growth Bundle
Number of Reports: 8
30%
tax inclusive*
Enterprise Bundle
Number of Reports: 10
35%
tax inclusive*
How To Order
Our step-by-step guide will help you select, purchase, and access your reports swiftly, ensuring you get the information that drives your decisions, right when you need it.

Select License Type
Choose the right license for your needs and access rights.

Click on ‘Buy Now’
Add the report to your cart with one click and proceed to register.

Select Mode of Payment
Choose a payment option for a secure checkout. You will be redirected accordingly.
Track prices with detailed trend reports.

Analyse trade data for supply chain insights.

Leverage cost reports for smart savings

Enhance supply chain with partnerships.

Gain insights to stay ahead and seize opportunities.

Get insights & trends for a competitive edge.

Track prices with detailed trend reports.
Analyse trade data for supply chain insights.
Leverage cost reports for smart savings
Enhance supply chain with partnerships.
Gain insights to stay ahead and seize opportunities.
Get insights & trends for a competitive edge.
Track prices with detailed trend reports.
Analyse trade data for supply chain insights.
Connect For More Information
Our expert team of analysts will offer full support and resolve any queries regarding the report, before and after the purchase.
Our expert team of analysts will offer full support and resolve any queries regarding the report, before and after the purchase.
We employ meticulous research methods, blending advanced analytics and expert insights to deliver accurate, actionable industry intelligence, staying ahead of competitors.
Our skilled analysts offer unparalleled competitive advantage with detailed insights on current and emerging markets, ensuring your strategic edge.
We offer an in-depth yet simplified presentation of industry insights and analysis to meet your specific requirements effectively.
Australia
63 Fiona Drive, Tamworth, NSW
+61-448-061-727
India
C130 Sector 2 Noida, Uttar Pradesh 201301
+91-723-689-1189
Philippines
40th Floor, PBCom Tower, 6795 Ayala Avenue Cor V.A Rufino St. Makati City,1226.
+63-287-899-028, +63-967-048-3306
United Kingdom
6 Gardner Place, Becketts Close, Feltham TW14 0BX, Greater London
+44-753-713-2163
United States
30 North Gould Street, Sheridan, WY 82801
+1-415-325-5166
Vietnam
193/26/4 St.no.6, Ward Binh Hung Hoa, Binh Tan District, Ho Chi Minh City
+84-865-399-124
United States (Head Office)
30 North Gould Street, Sheridan, WY 82801
+1-415-325-5166
Australia
63 Fiona Drive, Tamworth, NSW
+61-448-061-727
India
C130 Sector 2 Noida, Uttar Pradesh 201301
+91-723-689-1189
Philippines
40th Floor, PBCom Tower, 6795 Ayala Avenue Cor V.A Rufino St. Makati City, 1226.
+63-287-899-028, +63-967-048-3306
United Kingdom
6 Gardner Place, Becketts Close, Feltham TW14 0BX, Greater London
+44-753-713-2163
Vietnam
193/26/4 St.no.6, Ward Binh Hung Hoa, Binh Tan District, Ho Chi Minh City
+84-865-399-124


Share