

Consumer Insights
Uncover trends and behaviors shaping consumer choices today
Procurement Insights
Optimize your sourcing strategy with key market data
Industry Stats
Stay ahead with the latest trends and market analysis.

The United Kingdom webcam market reached around USD 402.46 Million in 2025. The market is projected to grow at a CAGR of 8.10% between 2026 and 2035 to reach nearly USD 876.96 Million by 2035.
Base Year
Historical Period
Forecast Period
Nearly 26.7% of British marketers spent 21%-30% of their budget on visual content marketing.
Nearly 20% of the visual marketing budget is spent on video production, animation, interactivity, and designing visual content.
Almost 20% of all British marketers include visuals in 91%-100% of their content.
Compound Annual Growth Rate
8.1%
Value in USD Million
2026-2035
*this image is indicative*
| United Kingdom Webcam Market Report Summary | Description | Value |
| Base Year | USD Million | 2025 |
| Historical Period | USD Million | 2019-2025 |
| Forecast Period | USD Million | 2026-2035 |
| Market Size 2025 | USD Million | 402.46 |
| Market Size 2035 | USD Million | 876.96 |
| CAGR 2019-2025 | Percentage | XX% |
| CAGR 2026-2035 | Percentage | 8.10% |
| CAGR 2026-2035 - Market by Region | Northern-Ireland | 8.7% |
| CAGR 2026-2035 - Market by Region | England | 7.8% |
| CAGR 2026-2035 - Market by End Use | Visual Marketing | 8.8% |
| CAGR 2026-2035 - Market by Distribution Channel | Online Channels | 14.9% |
| 2025 Market Share by Region | Wales | 4.8% |
Visual marketing is a critical marketing strategy for many businesses to drive consumer engagement and promote brand awareness. Nearly 33.3% of all UK-based content marketers include visuals in their content. Stock photos are used by nearly 40% of content marketers, while original graphics (20%), data visualisations and charts (13.3% each), and multi-page documents (6.7%) follow closely.
Nearly 20% of all British marketers spent over 20 hours designing influential visual content, while 13.3% spent nearly 5-10 hours. Nearly 26.7% of marketers use online platforms for designing visual content, followed by advanced software tools (20%). This highlights the substantial demand for visual marketing tools that foster excellent business outcomes and leave a lasting impression on consumers’ minds. The increasing shift towards visual marketing is expected to favour the demand for webcams over the forecast period.
Globally, 55% of companies allow their employees to work remotely, with 16% offering the option of full-time work from home. Nearly 77% of employees think it increases their productivity and 52% say it reduces the need to take holidays. Video conferencing plays a crucial role in enabling 80% of employees in an organisation to feel connected and work productively. This is expected to increase the demand for webcams in the UK in the forecast period.
United Kingdom Webcam Market Report and Forecast 2026-2035 offers a detailed analysis of the market based on the following segments:
Market Breakup by Webcam Type
Market Breakup by Technology
Market Breakup by End Use
Market Breakup by Distribution Channel
Market Breakup by Region
| CAGR 2026-2035 - Market by | End Use |
| Visual Marketing | 8.8% |
| Video Conference | 8.2% |
| Security and Surveillance | XX% |
| Entertainment | XX% |
| Live Events | XX% |
| Others | XX% |
| CAGR 2026-2035 - Market by | Distribution Channels |
| Online Channels | 14.9% |
| Offline Stores | XX% |
| CAGR 2026-2035 - Market by | Region |
| Northern-Ireland | 8.7% |
| England | 7.8% |
| Wales | XX% |
| Scotland | XX% |
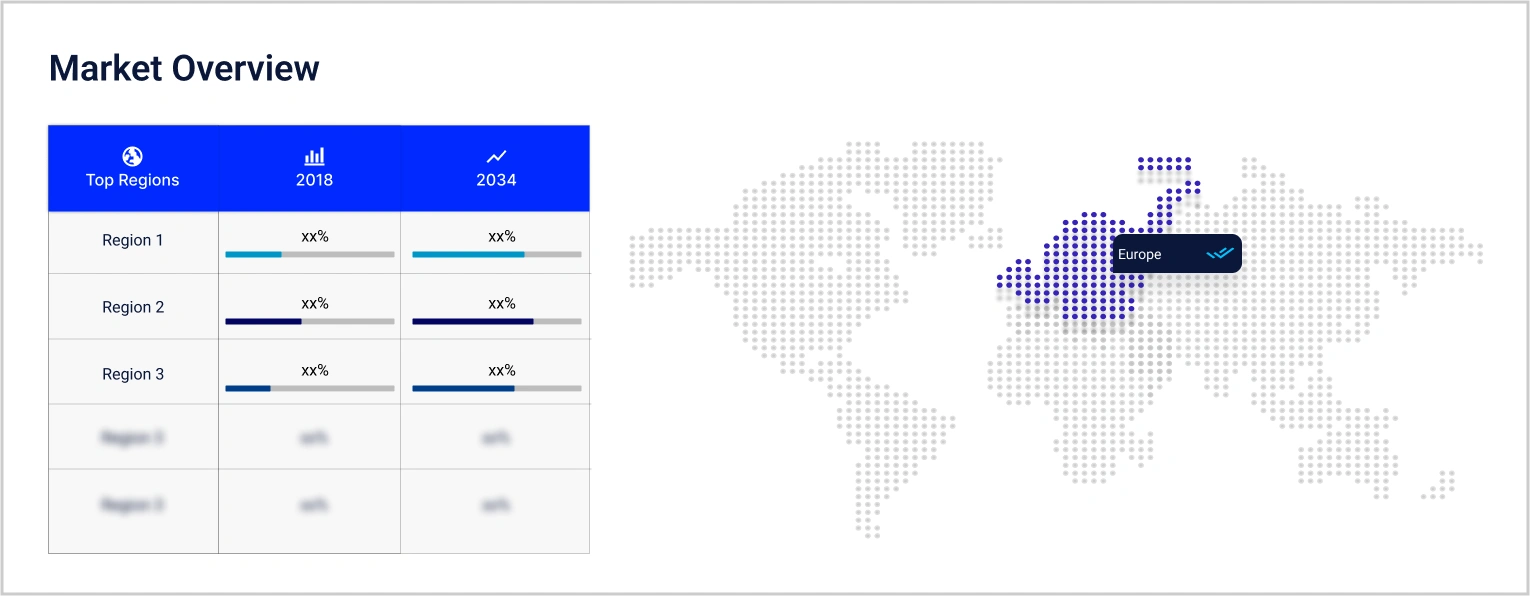
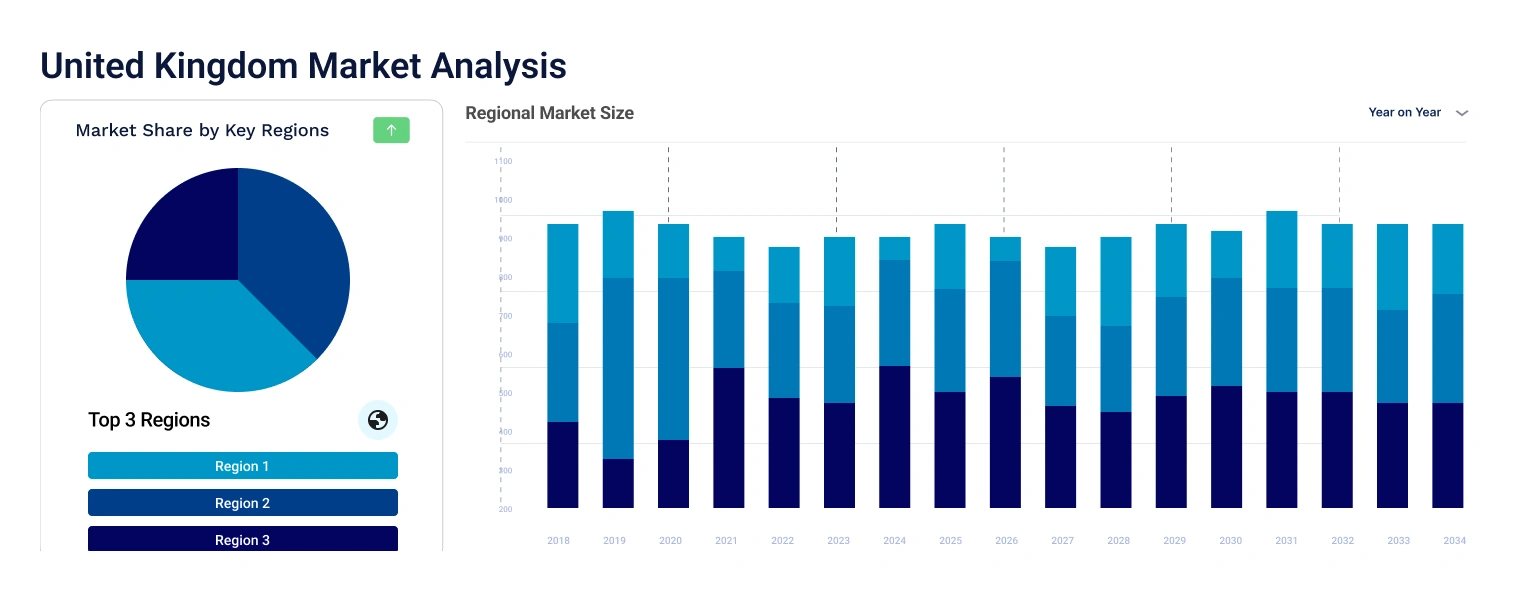
Based on region, the market is segmented into England, Wales, Northern Ireland, and Scotland, among others. Wales is projected to dominate the market, representing 4.8% of the overall market share. Over the forecast period of 2026-2035, Northern Ireland is projected to grow at a CAGR of 8.7%, due to the increasing demand for embedded digital cameras.
Major webcam manufacturers are improving the low-light performance of their products to ensure seamless late-night interaction between people. The introduction of high-resolution webcams which provide a sharper picture quality, is expected to drive the market growth in the forecast period.


Upto 15% Off
USD
$2499 $2249
$3999 $3599
$4999 $4249
$5999 $5099


*While we strive to always give you current and accurate information, the numbers depicted on the website are indicative and may differ from the actual numbers in the main report. At Expert Market Research, we aim to bring you the latest insights and trends in the market. Using our analyses and forecasts, stakeholders can understand the market dynamics, navigate challenges, and capitalize on opportunities to make data-driven strategic decisions.*
Get in touch with us for a customized solution tailored to your unique requirements and save upto 35%!
The market reached nearly USD 402.46 Million in 2025.
The market is projected to grow at a CAGR of 8.10% between 2026 and 2035.
The market is assessed to witness healthy growth in the forecast period to reach around USD 876.96 Million in 2035.
The different types of webcams in the market are external and embedded.
The different segments based on technology of webcam considered in the market report include analogue and digital.
The different distribution channels of webcams in the market are online and offline.
The different regions covered in the market report are England, Wales, Northern Ireland, and Scotland, among others.
The key market players are Logitech S.A., Microsoft Corporation, Razer Inc., Creative Technology Ltd., AUSODM, AVerMedia Technologies, Inc., Arashi Vision Inc., Papalook, Loocam Technology LLC, Corsair Memory Inc., among others.
Explore our key highlights of the report and gain a concise overview of key findings, trends, and actionable insights that will empower your strategic decisions.
| REPORT FEATURES | DETAILS |
| Base Year | 2025 |
| Historical Period | 2019-2025 |
| Forecast Period | 2026-2035 |
| Scope of the Report |
Historical and Forecast Trends, Industry Drivers and Constraints, Historical and Forecast Market Analysis by Segment:
|
| Breakup by Webcam Type |
|
| Breakup by Technology |
|
| Breakup by End Use |
|
| Breakup by Distribution Channel |
|
| Breakup by Region |
|
| Market Dynamics |
|
| Competitive Landscape |
|
| Companies Covered |
|
Datasheet
One User
USD 2,499
USD 2,249
tax inclusive*
Single User License
One User
USD 3,999
USD 3,599
tax inclusive*
Five User License
Five User
USD 4,999
USD 4,249
tax inclusive*
Corporate License
Unlimited Users
USD 5,999
USD 5,099
tax inclusive*
*Please note that the prices mentioned below are starting prices for each bundle type. Kindly contact our team for further details.*
Flash Bundle
Small Business Bundle
Growth Bundle
Enterprise Bundle
*Please note that the prices mentioned below are starting prices for each bundle type. Kindly contact our team for further details.*
Flash Bundle
Number of Reports: 3
20%
tax inclusive*
Small Business Bundle
Number of Reports: 5
25%
tax inclusive*
Growth Bundle
Number of Reports: 8
30%
tax inclusive*
Enterprise Bundle
Number of Reports: 10
35%
tax inclusive*
How To Order

Select License Type
Choose the right license for your needs and access rights.

Click on ‘Buy Now’
Add the report to your cart with one click and proceed to register.

Select Mode of Payment
Choose a payment option for a secure checkout. You will be redirected accordingly.
Gain insights to stay ahead and seize opportunities.

Get insights & trends for a competitive edge.

Track prices with detailed trend reports.

Analyse trade data for supply chain insights.

Leverage cost reports for smart savings

Enhance supply chain with partnerships.

Connect For More Information
Our expert team of analysts will offer full support and resolve any queries regarding the report, before and after the purchase.
Our expert team of analysts will offer full support and resolve any queries regarding the report, before and after the purchase.
We employ meticulous research methods, blending advanced analytics and expert insights to deliver accurate, actionable industry intelligence, staying ahead of competitors.
Our skilled analysts offer unparalleled competitive advantage with detailed insights on current and emerging markets, ensuring your strategic edge.
We offer an in-depth yet simplified presentation of industry insights and analysis to meet your specific requirements effectively.


Share