

Consumer Insights
Uncover trends and behaviors shaping consumer choices today
Procurement Insights
Optimize your sourcing strategy with key market data
Industry Stats
Stay ahead with the latest trends and market analysis.

The United Kingdom bronze market size reached around USD 0.37 Billion in 2025. The market is projected to grow at a CAGR of 3.20% between 2026 and 2035 to reach nearly USD 0.51 Billion by 2035.
Base Year
Historical Period
Forecast Period
The UK’s machinery and equipment (M&E) manufacturing industry accounts for 7% of total value added in the economy.
The United Kingdom is the 10th largest exporter of machinery and equipments globally. This has subsequently contributed to the United Kingdom bronze market revenue.
Nearly 10.3% of the UK’s total exports include M&E, which is mostly dominated by construction, mining, and quarrying machines.
Compound Annual Growth Rate
3.2%
Value in USD Billion
2026-2035
*this image is indicative*
| United Kingdom Bronze Market Report Summary | Description | Value |
| Base Year | USD Billion | 2025 |
| Historical Period | USD Billion | 2019-2025 |
| Forecast Period | USD Billion | 2026-2035 |
| Market Size 2025 | USD Billion | 0.37 |
| Market Size 2035 | USD Billion | 0.51 |
| CAGR 2019-2025 | Percentage | XX% |
| CAGR 2026-2035 | Percentage | 3.20% |
| CAGR 2026-2035 - Market by Region | Wales | 3.4% |
| CAGR 2026-2035 - Market by Region | England | 3.1% |
| CAGR 2026-2035 - Market by Alloy Type | Aluminium | 3.6% |
| CAGR 2026-2035 - Market by Application | Transportation | 3.8% |
| 2025 Market Share by Region | England | 78.4% |
The United Kingdom’s machinery and equipment (M&E) production sector has made significant investments in factory optimisation and automation processes to boost industrial productivity. As per the United Nations, the UK exported USD 42 billion worth of machinery and equipments worldwide, while accounting for 2.6% of the global market share. Moreover, in 2021, the average productivity of the UK’s M&E sector was 60% higher than the domestic economy, and 37% higher than that of the manufacturing industry. This is creating a favourable United Kingdom bronze market outlook.
Similarly, the United Kingdom exports over 60% of its output of construction equipment, as per the Construction Equipment Association. As per the market analysis, it also exported over 80% of its cutting tools and work-holding equipments in 2020. In 2022, the top 5 M&E sub-sectors, such as mining, quarrying, and construction machinery; pumps and compressors; general-purpose machinery; and other engines accounted for 58.6% of total industrial exports. As the UK continues to lead the production of industrial machinery, the market is expected to witness sustained growth over the forecast period.
| 2025 Market Share by | Region |
| England | 78.4% |
| Wales | XX% |
| Northern Ireland | XX% |
| Scotland | XX% |
Growth of the construction sector; expansion of the agricultural sector; rising demand from marine and shipbuilding sector; and increasing automotive sales are factors favouring the United Kingdom bronze market expansion
The S&P Global UK Construction Purchasing Managers Index (PMI) increased to 57.2 in September 2024 from 53.6 in August 2024. This is expected to fuel the demand for bronze sheets and bars, which are used to enhance the structural integrity of different buildings, ultimately increasing the United Kingdom bronze market share.
In 2021, the total cultivation area in the UK recorded a y-o-y growth of 0.5% and reached 6.1 million hectares. The cultivation of cereal crops rose to 3.2 million hectares, which further raised the demand for heavy agricultural machinery such as tractors for ploughing and harvesting operations. Such machineries use bronze extensively in making of components, driving the United Kingdom bronze market value.
The growing demand for ships is expected to fuel the demand for bronze, as it is extensively used to make bushes and bearings for shipbuilding, which ensure its performance in rough weather conditions and in choppy waters.
The growing sales of superminis (29.8%), SUVs (28.6%), and crossovers (28.3%) indicates rising consumer preference for private vehicles which is favourably shaping the United Kingdom bronze market outlook.
As per the Society of Motor Manufacturers and Traders, the demand for fleet cars rose by 1.1 million in 2023, recording a y-o-y growth of 38.7%. The growing demand for hybrids (27.1%) and plug-in hybrids (39.3%) is fuelling the growth of the automotive industry, thereby favouring the growth of the United Kingdom bronze market. Every 1 of 6 vehicles registered in the UK currently is an EV, with overall sales rising to 315,000. Bronze, which is extensively used in the production of batteries, engines, decorative elements of automotives is expected to witness a significant surge in demand over the forecast period.
The EMR’s report titled “United Kingdom Bronze Market Report and Forecast 2026-2035” offers a detailed analysis of the market based on the following segments:
Market Breakup by Alloy Type
Market Breakup by Application
Market Breakup by Region
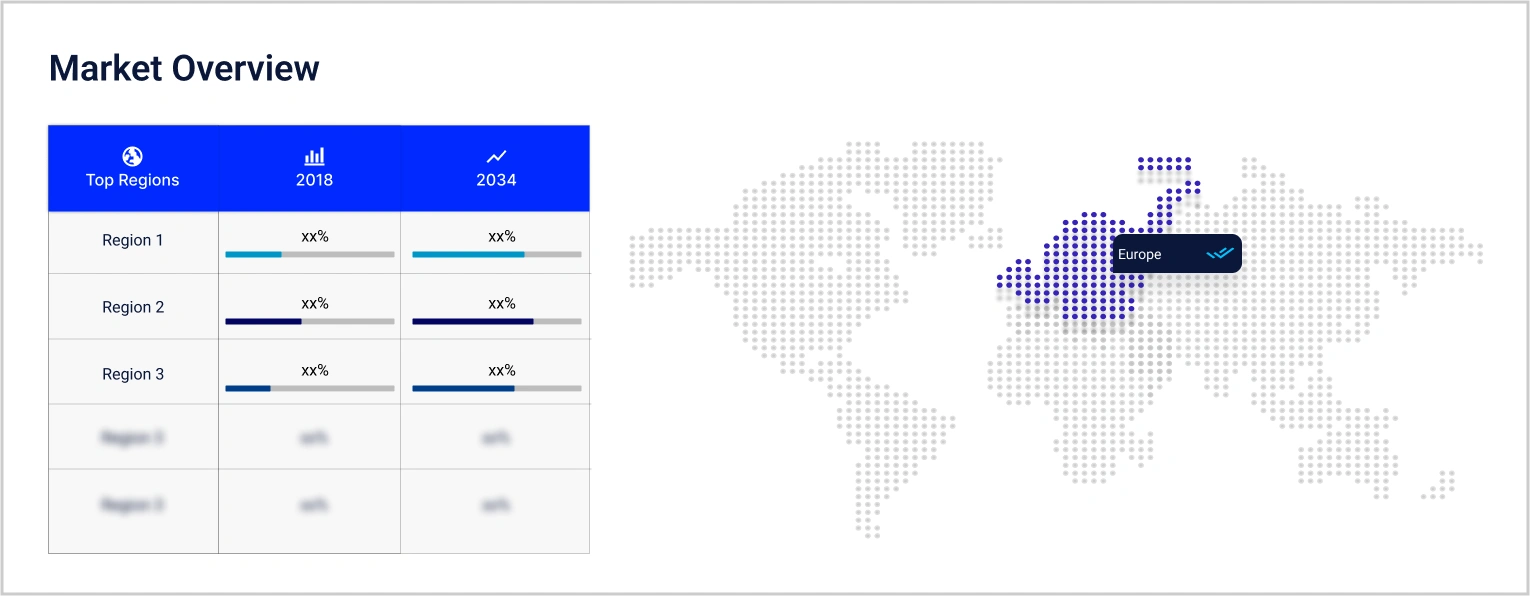
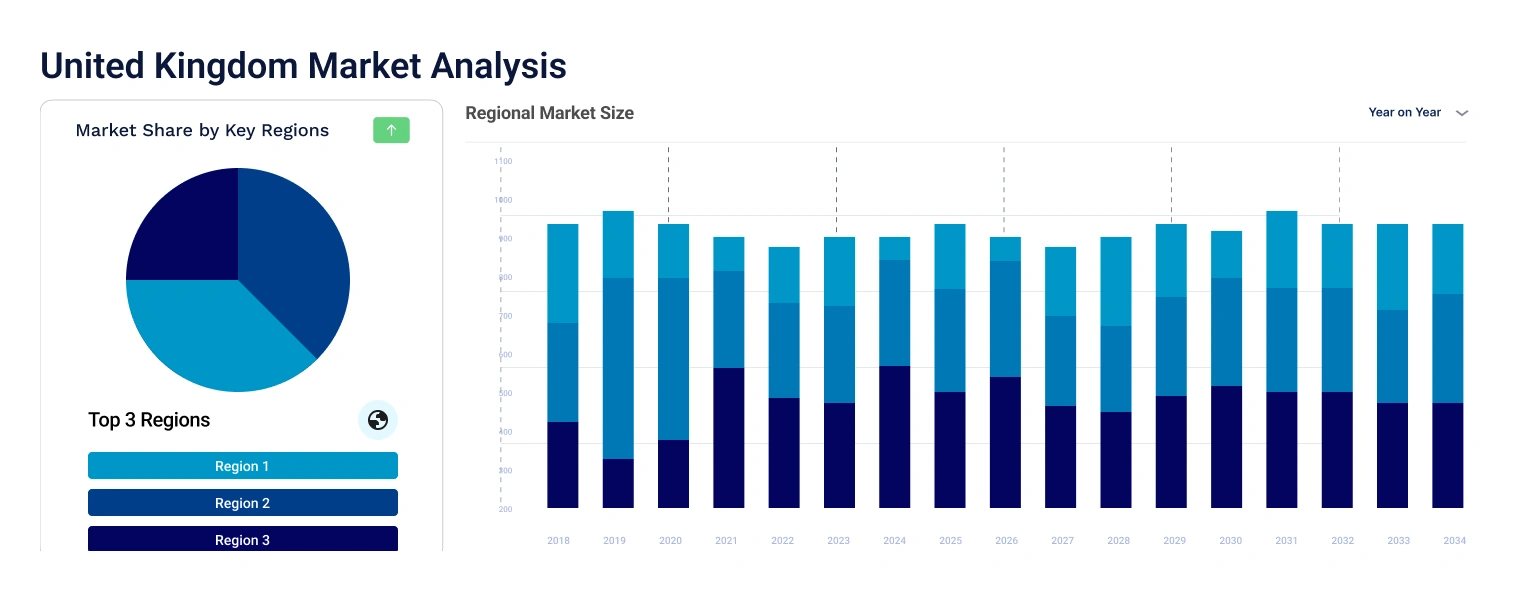
Based on region, the market is segmented into England, Wales, Northern Ireland, and Scotland. England is projected to dominate the market, representing 78% of the overall market share. Over the forecast period, Wales is expected to grow at a CAGR of 3.4% because of increasing adoption of EVs in the region.
| CAGR 2026-2035 - Market by | Region |
| Wales | 3.4% |
| England | 3.1% |
| Northern Ireland | XX% |
| Scotland | XX% |
Major players are expected to benefit from the shipbuilding boom in the United Kingdom, driven by increasing government investments to decarbonise the sector.
KME Germany GmbH belongs to the KME Group S.p.A. Based in Osnabrück, German, it is one of the largest producers of copper-based products (and alloys). It was formed in 1873 and sold 195.721 tons of materials in 2022-23, which highlights its solid position in North America bronze market.
Lebronze alloys was formed in 1934 and is based in Suippes, France. It specialises in manufacturing finished, semi-finished, and preformed products from metals like copper, and aluminum, or its alloys.
Leeds Bronze Engineering Ltd. was formed in 1974 and is headquartered in the Leeds, United Kingdom. It belongs to the Calder Group and is the largest domestic producer of bronze bushes and bearings.
Wieland-Werke AG was formed in 1820 in Ulm, Germany. It is engaged in offering semi-finished copper products across 79 different locations worldwide and has witnessed substantial turnovers in recent years.
*Please note that this is only a partial list; the complete list of key players is available in the full report. Additionally, the list of key players can be customized to better suit your needs.*
Other players included in the United Kingdom bronze market report are INNOMetal GmbH, among others.


Upto 15% Off
USD
$2499 $2249
$3999 $3599
$4999 $4249
$5999 $5099


*While we strive to always give you current and accurate information, the numbers depicted on the website are indicative and may differ from the actual numbers in the main report. At Expert Market Research, we aim to bring you the latest insights and trends in the market. Using our analyses and forecasts, stakeholders can understand the market dynamics, navigate challenges, and capitalize on opportunities to make data-driven strategic decisions.*
Get in touch with us for a customized solution tailored to your unique requirements and save upto 35%!
In 2025, the market reached an approximate value of USD 0.37 Billion.
The market is projected to grow at a CAGR of 3.20% between 2026 and 2035.
The market is estimated to witness healthy growth in the forecast period of 2026-2035 to reach a value of around USD 0.51 Billion by 2035.
Key trends aiding the market expansion are increasing automotive sales and the growth of industries such as construction, agriculture, and shipbuilding.
The different applications of bronze include architectural parts, musical instruments, transportation, and industrial, among others.
The different types of alloys in the market are aluminium, phosphor, and silicon.
The key market players are KME Germany GmbH, Wieland-Werke AG, Lebronze alloys, INNOMetal GmbH, and Leeds Bronze Engineering Ltd., among others.
Explore our key highlights of the report and gain a concise overview of key findings, trends, and actionable insights that will empower your strategic decisions.
| REPORT FEATURES | DETAILS |
| Base Year | 2025 |
| Historical Period | 2019-2025 |
| Forecast Period | 2026-2035 |
| Scope of the Report |
Historical and Forecast Trends, Industry Drivers and Constraints, Historical and Forecast Market Analysis by Segment:
|
| Breakup by Alloy Type |
|
| Breakup by Application |
|
| Breakup by End Use |
|
| Breakup by Region |
|
| Market Dynamics |
|
| Competitive Landscape |
|
| Companies Covered |
|
Datasheet
One User
USD 2,499
USD 2,249
tax inclusive*
Single User License
One User
USD 3,999
USD 3,599
tax inclusive*
Five User License
Five User
USD 4,999
USD 4,249
tax inclusive*
Corporate License
Unlimited Users
USD 5,999
USD 5,099
tax inclusive*
*Please note that the prices mentioned below are starting prices for each bundle type. Kindly contact our team for further details.*
Flash Bundle
Small Business Bundle
Growth Bundle
Enterprise Bundle
*Please note that the prices mentioned below are starting prices for each bundle type. Kindly contact our team for further details.*
Flash Bundle
Number of Reports: 3
20%
tax inclusive*
Small Business Bundle
Number of Reports: 5
25%
tax inclusive*
Growth Bundle
Number of Reports: 8
30%
tax inclusive*
Enterprise Bundle
Number of Reports: 10
35%
tax inclusive*
How To Order

Select License Type
Choose the right license for your needs and access rights.

Click on ‘Buy Now’
Add the report to your cart with one click and proceed to register.

Select Mode of Payment
Choose a payment option for a secure checkout. You will be redirected accordingly.
Gain insights to stay ahead and seize opportunities.

Get insights & trends for a competitive edge.

Track prices with detailed trend reports.

Analyse trade data for supply chain insights.

Leverage cost reports for smart savings

Enhance supply chain with partnerships.

Connect For More Information
Our expert team of analysts will offer full support and resolve any queries regarding the report, before and after the purchase.
Our expert team of analysts will offer full support and resolve any queries regarding the report, before and after the purchase.
We employ meticulous research methods, blending advanced analytics and expert insights to deliver accurate, actionable industry intelligence, staying ahead of competitors.
Our skilled analysts offer unparalleled competitive advantage with detailed insights on current and emerging markets, ensuring your strategic edge.
We offer an in-depth yet simplified presentation of industry insights and analysis to meet your specific requirements effectively.


Share