

Consumer Insights
Uncover trends and behaviors shaping consumer choices today
Procurement Insights
Optimize your sourcing strategy with key market data
Industry Stats
Stay ahead with the latest trends and market analysis.

The global topical pain relief market attained a value of about USD 11.14 Billion in 2025, driven by the rising prevalence of arthritis and bone-related diseases, and the growing geriatric population across the globe. The market is further expected to grow at a CAGR of 5.00% during the forecast period of 2026-2035 to reach nearly USD 18.15 Billion by 2035.
Base Year
Historical Period
Forecast Period
The market is significantly driven by the increasing incidence of bone-related diseases and the growing elderly population across the globe.
The innovative product launches by the market players are contributing to enhanced patient experience, bolstering market growth.
The surge in the preference for natural and organic ingredients is one of the major market trends.
Compound Annual Growth Rate
5%
Value in USD Billion
2026-2035
*this image is indicative*
Topical pain relief agents are used to treat muscle pains, sprains, and strains. They can also help relieve painful arthritis. Since topical analgesics have fewer side effects than oral painkillers, they are often prescribed instead of oral painkillers. Factors driving market growth include increased adoption of topical pain-relieving drugs, which have fewer side effects than oral pain relievers, the growing global geriatric population, and an increase in demand for topical pain relievers among athletes. Further, expanding online retail channels for topical therapeutics is expected to provide the industry with lucrative growth opportunities.
Rising Incidence of Bone-related Issues Boosts the Market Growth
The World Health Organization estimated that around 619 million individuals registered with lower back pain (LBP) in 2020. These cases are expected to increase to 843 million cases by 2050. The growing geriatric population significantly drives the increase in the number of cases.
The increasing prevalence of arthritis and other bone-related diseases, as well as diabetic neuropathy, which causes pain, is driving the growth of the market.
Expedited Product Developments to Meet Rising Topical Pain Relief Market Demand
The market is significantly driven by the rising demand for non-invasive, fast-acting pain relief solutions. The market players are considering consumer preference for different formulations and forms of topical analgesics. For instance, in September 2024, Mankind Pharma’s consumer business division launched a new solution for neck pain, Nimulid Strong, a gel and spray formulation to address neck pain, which impacts overall body function. The new solution has 2x diclofenac concentration that claims fast pain relief. This focus on consumer preference is poised to augment the increased adoption of newly launched topical solutions, especially in spray forms, bolstering market growth.
Further, the growing demand for non-opioid pain relief solutions, coupled with increasing consumer preference for over-the-counter (OTC) medications is driving innovation in the topical pain management market. Moreover, the rising awareness of the harmful side effects of consuming oral pain relievers for the long term is further creating a need for market players to develop targeted, user-friendly solutions. For instance, in September 2023, Kenvue Inc. showcased its new topical Tylenol Precise Pain Relieving Cream at PAINWeek Conference 2023. The new pain reliever ointment consists of maximum-strength lidocaine 40% that provides targeted pain relief seamlessly. In view of recent consumer data, around 40% of individuals dislike the way medicated topical solutions smell and feel. Therefore, Kenvue designed a hands-free application with a rollerball with a fresh scent and fragrance-free formula to enhance the consumer experience.
The market is witnessing several trends and developments to improve the current scenario. Some of the notable trends are as follows:
"Topical Pain Relief Market Report and Forecast 2026-2035” offers a detailed analysis of the market based on the following segments:
Market Breakup by Therapeutics
Market Breakup by Formulation
Market Breakup by Distribution Channel
Market Breakup by Region
Cream Formulation Leads the Market Share
The market segmentation by formulation includes cream, spray, gel, patch, and others. Cream formulations are expected to lead the market share due to their widespread use, ease of application, and effectiveness in delivering pain relief. Consumers prefer creams as they get easily absorbed into the skin, offering fast-acting relief for localised pain such as muscle aches, joint pain, and arthritis. Additionally, creams often contain popular active ingredients like menthol, capsaicin, or lidocaine, which are highly effective in targeting pain receptors. Their non-greasy texture and availability in over-the-counter and prescription forms contribute to the high demand and increased adoption in the market.
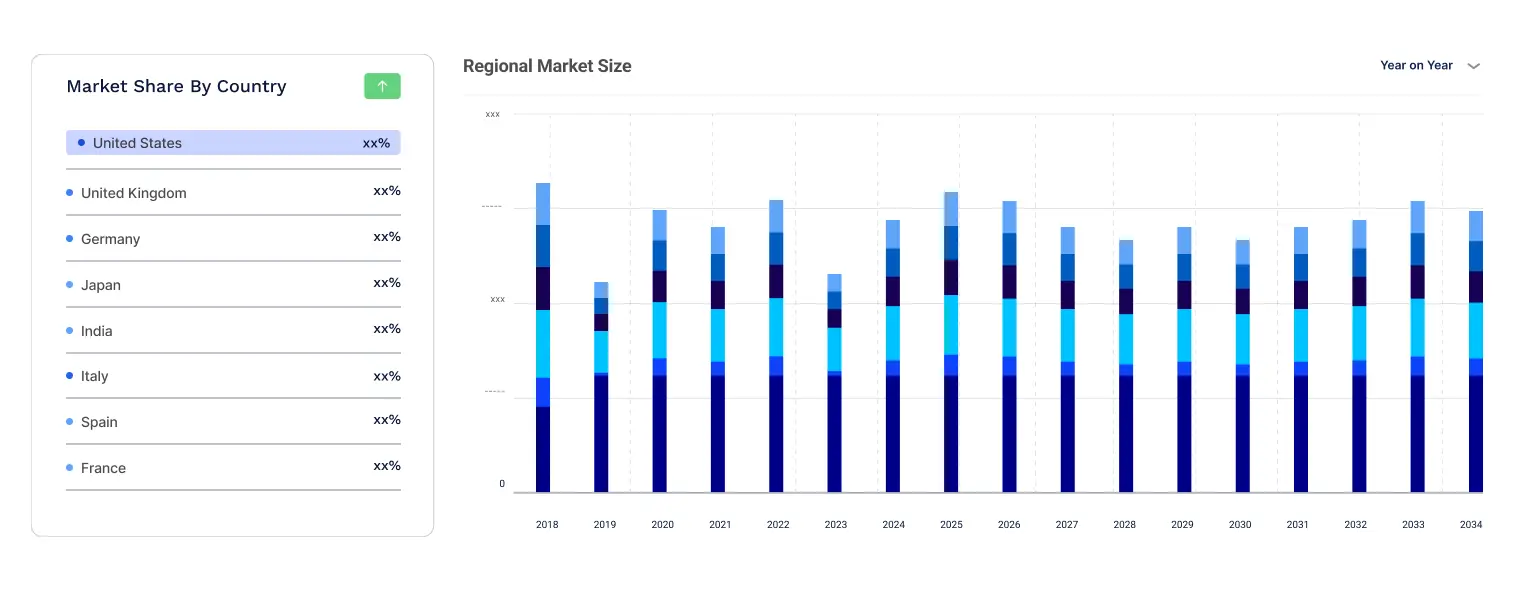
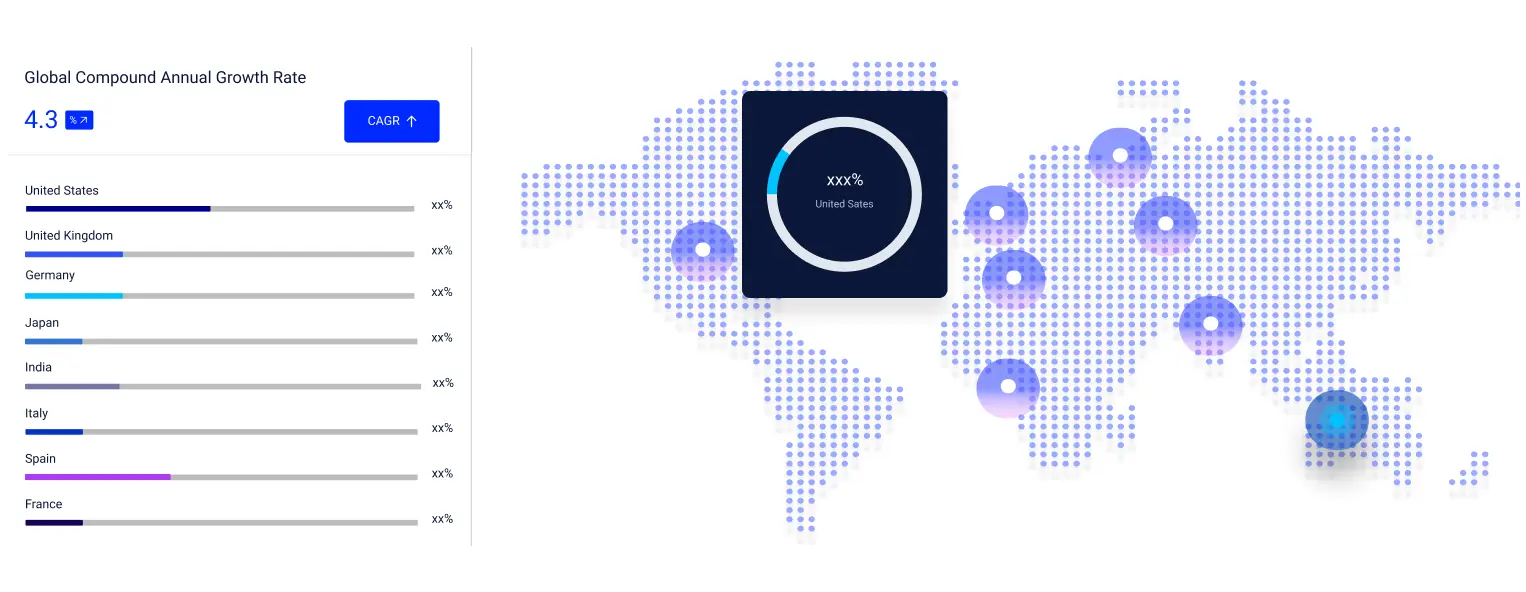
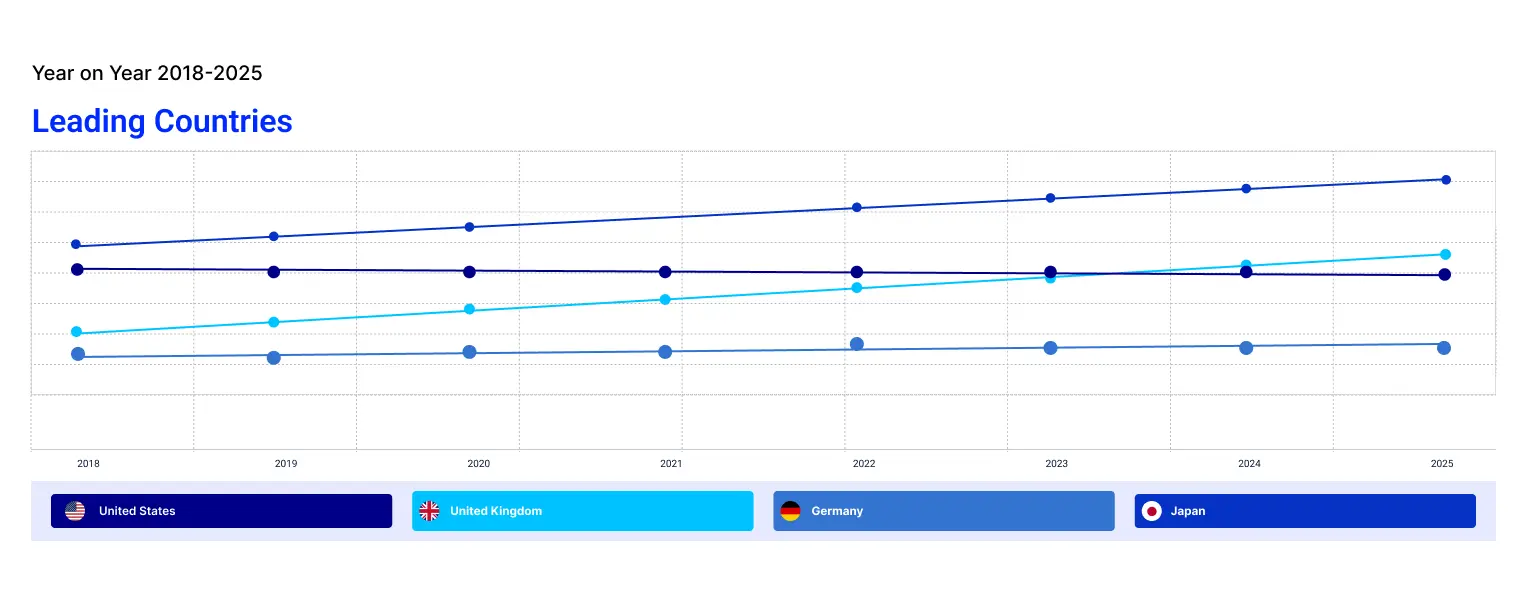
Based on region, the United States leads the regional market share, driven by the rising prevalence of chronic pain conditions such as arthritis, back pain, and neuropathy. The market is further driven by the growing geriatric population, and a shift towards self-medication for pain management, contributing to increased adoption of topical pain relief solutions. Increasing awareness about non-opioid alternatives for pain management is collectively fueling the demand for topical pain relief products in the market. Technological advancements in product formulations, including innovations like lidocaine patches and menthol-based creams are attracting a large consumer base, thereby increasing the market share of the region. Moreover, consumer preference for over-the-counter (OTC) products and the widespread availability of topical solutions across various retail channels, including e-commerce, are accelerating the market expansion in the United States.
The key features of the market report comprise patent analysis, clinical trials analysis, grant analysis, funding and investment analysis and strategic initiatives by the leading players. The major companies in the market are as follows:
Headquartered in New Jersey, USA, Johnson & Johnson is a multinational pharmaceutical, biotechnology, and medical technologies conglomerate specialising in surgical instruments and technologies.
Founded in 1849 and headquartered in New York City, Pfizer is a leading biopharmaceutical company. It is renowned for its extensive portfolio in the pharmaceutical market, offering treatments for various medical fields, including oncology, vaccines, internal medicine, and rare diseases, with a strong focus on innovative research.
Founded in 2000 and headquartered in London, GSK plc is a global pharmaceutical company specialising in the research and development of vaccines, medicines, and consumer healthcare products. GSK offers products like Voltaren and Panadol, providing effective solutions for pain management through topical gels and creams.
Sanofi is a multinational pharmaceutical company with a focus on research and development across various therapeutic areas. Sanofi’s portfolio includes antiretroviral therapies and immunotherapies aimed at improving viral suppression and enhancing patient quality of life.
Reckitt Benckiser Group plc, established in 1999 and headquartered in Slough, England, is a global consumer goods company. Its portfolio in topical pain relief includes well-known brands like Nurofen and Deep Heat, offering a range of products such as gels, creams, and patches for effective pain management.
*Please note that this is only a partial list; the complete list of key players is available in the full report. Additionally, the list of key players can be customized to better suit your needs.*
Other key players in the market include Topical Biomedics, Hisamitsu Pharmaceutical Co., Inc., Sun Pharmaceutical Industries Ltd., and Haw Par Corporation Ltd.
India Topical Pain Relief Market
Japan Topical Pain Relief Market
United States Topical Pain Relief Market


Upto 15% Off
USD
$3299 $2969
$5499 $4949
$6999 $5949
$8199 $6969


*While we strive to always give you current and accurate information, the numbers depicted on the website are indicative and may differ from the actual numbers in the main report. At Expert Market Research, we aim to bring you the latest insights and trends in the market. Using our analyses and forecasts, stakeholders can understand the market dynamics, navigate challenges, and capitalize on opportunities to make data-driven strategic decisions.*
Get in touch with us for a customized solution tailored to your unique requirements and save upto 35%!
Explore our key highlights of the report and gain a concise overview of key findings, trends, and actionable insights that will empower your strategic decisions.
| REPORT FEATURES | DETAILS |
| Base Year | 2025 |
| Historical Period | 2019-2025 |
| Forecast Period | 2026-2035 |
| Scope of the Report |
Historical and Forecast Trends, Industry Drivers and Constraints, Historical and Forecast Market Analysis by Segment:
|
| Breakup by Therapeutic |
|
| Breakup by Formulation |
|
| Breakup by Distribution Channel |
|
| Breakup by Region |
|
| Market Dynamics |
|
| Supplier Landscape |
|
| Companies Covered |
|
Datasheet
One User
USD 3,299
USD 2,969
tax inclusive*
Single User License
One User
USD 5,499
USD 4,949
tax inclusive*
Five User License
Five User
USD 6,999
USD 5,949
tax inclusive*
Corporate License
Unlimited Users
USD 8,199
USD 6,969
tax inclusive*
*Please note that the prices mentioned below are starting prices for each bundle type. Kindly contact our team for further details.*
Flash Bundle
Small Business Bundle
Growth Bundle
Enterprise Bundle
*Please note that the prices mentioned below are starting prices for each bundle type. Kindly contact our team for further details.*
Flash Bundle
Number of Reports: 3
20%
tax inclusive*
Small Business Bundle
Number of Reports: 5
25%
tax inclusive*
Growth Bundle
Number of Reports: 8
30%
tax inclusive*
Enterprise Bundle
Number of Reports: 10
35%
tax inclusive*
How To Order

Select License Type
Choose the right license for your needs and access rights.

Click on ‘Buy Now’
Add the report to your cart with one click and proceed to register.

Select Mode of Payment
Choose a payment option for a secure checkout. You will be redirected accordingly.
Gain insights to stay ahead and seize opportunities.

Get insights & trends for a competitive edge.

Track prices with detailed trend reports.

Analyse trade data for supply chain insights.

Leverage cost reports for smart savings

Enhance supply chain with partnerships.

Connect For More Information
Our expert team of analysts will offer full support and resolve any queries regarding the report, before and after the purchase.
Our expert team of analysts will offer full support and resolve any queries regarding the report, before and after the purchase.
We employ meticulous research methods, blending advanced analytics and expert insights to deliver accurate, actionable industry intelligence, staying ahead of competitors.
Our skilled analysts offer unparalleled competitive advantage with detailed insights on current and emerging markets, ensuring your strategic edge.
We offer an in-depth yet simplified presentation of industry insights and analysis to meet your specific requirements effectively.


Share