

Consumer Insights
Uncover trends and behaviors shaping consumer choices today
Procurement Insights
Optimize your sourcing strategy with key market data
Industry Stats
Stay ahead with the latest trends and market analysis.

The global tomato processing market is aided by the rising production as well as consumption of processed tomatoes. In 2025, 88.94 Million Tons of processed tomatoes were consumed globally. Their consumption is expected to grow further, growing at a CAGR of 3.80% in the forecast period of 2026-2035 to attain 129.14 Million Tons in 2035.
Base Year
Historical Period
Forecast Period
The growth in global tomato production, with over 189.1 million metric tonnes produced in 2021, as per the industry reports, is boosting the tomato processing market. Increased yields provide an abundant supply of raw materials for processing, ensuring market growth in areas like sauces, pastes, and canned products.
China, producing around 60 million tonnes of tomatoes annually, is a major contributor to the market. The country’s high production levels ensure a steady supply of tomatoes, enhancing the availability of processed products for domestic and international markets, especially in Asia.
According to the Australian Processing Tomato Research Council, Australian growers produced 226,439 tonnes of processing tomatoes in the 2021/22 season. This local production supports the growing demand for processed tomato products, contributing to market stability and offering opportunities for export within the Asia-Pacific region.
Compound Annual Growth Rate
3.8%
Value in Million Tons
2026-2035
*this image is indicative*
The Asia Pacific is the largest producer of tomatoes accounting for over half their global production. Middle East and Africa followed Asia Pacific as their leading producer. The United States, on the other hand, is the largest tomato processing country with a global market share of over 35%. In 2017, tomatoes represented 70% of the total processing vegetables in the United States with 22, 011.7 million pounds selected for processing. They were also the leading crops in the United States in terms of processing-vegetable farm value, being worth USD 912 million in 2017. Italy and China were also significant markets in the industry along with Turkey and Iran.
Read more about this report - REQUEST FREE SAMPLE COPY IN PDF
The imports of processed tomatoes from Ukraine to the EU saw a significant increase of 17% in 2017, as compared to 2016, due to be a competitive market, and due to a sharp decrease in imports from China. The Ukraine exports to the European Union of processed tomatoes will continue growing, rising by 15% in 2018, from 2017. European Union imports of fresh tomatoes saw an 8% increase supported by the 42% growth in imports from Turkey in 2017, as compared to the previous year.
The tomato processing market is expanding due to the rising demand for convenience foods, the growing focus on health and nutritional benefits, advancements in processing technologies, and the increasing emphasis on sustainability and eco-friendly practices.
The increasing preference for convenience foods, including ready-to-eat meals and packaged sauces, is significantly boosting the global tomato processing market. As consumers seek quick meal options, the demand for processed tomato products such as sauces, purees, and pastes has risen, stimulating market growth. In November 2022, the Department of Consumer Affairs launched the 'Tomato Grand Challenge' hackathon to combat tomato wastage, selecting 28 out of 1,376 proposals to support prototype development and mentorship, focusing on tomato processing into various products.
Rising awareness of the health benefits of tomatoes, such as their high antioxidant and vitamin content, is contributing to the expansion of the market. Consumers are increasingly turning to processed tomato products, including organic purees and low-sodium sauces, as part of a healthier diet. In March 2021, WayBeyond launched its Crop Registration app to assist tomato growers. The app streamlines data collection, improving efficiency and decision-making for farmers, while integrating with the FarmRoad platform for enhanced insights.
Technological advancements in tomato processing, including improvements in pasteurisation, canning, and drying methods, are enhancing the efficiency and quality of processed products. These innovations reduce production costs, extend shelf life, and help meet the growing global demand for processed tomatoes. In July 2022, HRS Process Systems introduced advanced turnkey processing lines for producing high-quality tomato paste and puree. The company’s eco-friendly solutions address challenges in fresh tomato handling while contributing to the growth of the Indian tomato processing market.
The tomato processing market is increasingly focusing on sustainability, with companies adopting eco-friendly practices such as reducing water and energy usage, and minimising waste. These measures not only meet consumer demand for sustainable products but also help reduce environmental impact, supporting long-term market growth. In July 2024, the Andhra Pradesh government announced plans to set up an ₹8.42 crore tomato processing unit in Kuppam. This initiative aims to support local tomato farmers and promote sustainable practices in the region.
Tomatoes, initially consumed by Mexicans, spread across the globe due to the colonisation of the Americas by the Spanish. Their processing started in 1847 with manual canning. Today, tomato processing is highly organised and generates sales worth billions of dollars.
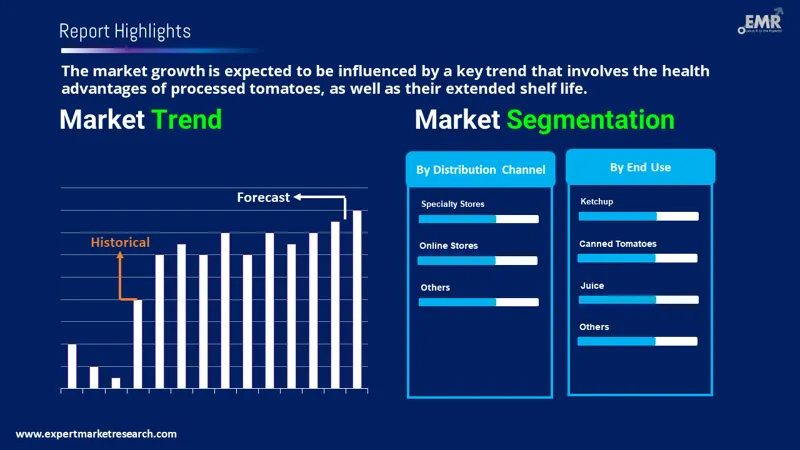
Based on distribution channels, the market can be divided into:
Processed tomatoes find their end-use in products like:
Market Breakup by Region:
Read more about this report - REQUEST FREE SAMPLE COPY IN PDF
Only around one-fifth of the tomatoes produced globally are processed with the majority of them being consumed fresh. Processed tomatoes find their maximum application in sauces, which accounts for nearly 30% of their total global application. In 2018, about 12 million tons of sauces were consumed globally. Pastes are another application segment that dominated the market.
The global tomato processing market is being driven by the extensive applications of processed tomatoes in sectors like household, food processing, and snack foods. They are also used widely in the foodservice industry in hotels, restaurants, and fast food retail chains. With the fast food industry thriving globally, the market is being propelled forward. The growing organised retail sector is also providing further impetus to the market growth. The additional health benefits of processed tomatoes along with their longer shelf life is driving their demand. Tomato puree is an especially significant processed product as it finds expansive use across various value-added products like tomato juice, ketchup, paste, strained tomato pulp, pickles, pasta, pizza sauces, salsa, gravies, ready-to-eat curries, and tomato-based powder products.
The global production of processed tomatoes saw a decrease in 2018 with key markets like China experiencing a sharp decline in production. However, markets like California were still thriving with a 13% increase in 2018, as compared to the previous year. In the European Union, with Europe accounting for 11% of the global tomato production, their production for processing increased by 6% in 2017, as compared to 2016. Around 11.5 million tons of the vegetable were processed in 2017 in the EU.


The tomato processing market key players are recognised for producing premium-quality tomatoes, which are used in a variety of products such as tomato paste, sauces, and diced tomatoes. They have built a strong reputation for excellence in agricultural practices, ensuring reliable, high-yield harvests. With large-scale farms and processing plants, these companies utilise advanced technologies to uphold product quality and cater to the increasing global demand.
Founded in 1869 and headquartered in New Jersey, United States, Campbell Soup Company is a leading producer of soups, beverages, and snacks. Known for its iconic Campbell's brand, it also owns various other food brands and focuses on providing convenient, nutritious meals to customers worldwide.
Established in 1921, J.G. Boswell Tomato Company, based in California, United States, is renowned for its high-quality tomatoes and tomato-based products. The company operates extensive farming and processing operations, supplying fresh and canned tomato products to markets globally, known for innovation and sustainable farming practices.
Founded in 1996, Chumak is a Ukrainian food company headquartered in Kyiv. Specialising in high-quality tomato products, oils, and other food items, Chumak is a leading brand in Ukraine, known for its commitment to quality and local ingredient sourcing, serving both domestic and international markets.
MorningStar Farms, established in 1975 and based in Michigan, United States is a subsidiary of Kellogg Company. It is a pioneer in plant-based food products, particularly vegetarian and vegan options, and remains a market leader in offering meat alternatives, focusing on sustainable and healthier food choices.
*Please note that this is only a partial list; the complete list of key players is available in the full report. Additionally, the list of key players can be customized to better suit your needs.*
Another key player in the tomato processing market report is CONESA Group among others.


Upto 15% Off
USD
$2499 $2249
$3999 $3599
$4999 $4249
$5999 $5099


*While we strive to always give you current and accurate information, the numbers depicted on the website are indicative and may differ from the actual numbers in the main report. At Expert Market Research, we aim to bring you the latest insights and trends in the market. Using our analyses and forecasts, stakeholders can understand the market dynamics, navigate challenges, and capitalize on opportunities to make data-driven strategic decisions.*
Get in touch with us for a customized solution tailored to your unique requirements and save upto 35%!
The consumption volume of processed tomatoes reached around 88.94 Million Tons in 2025.
The consumption of the product is expected to grow at a CAGR of nearly 3.80% in the forecast period of 2026-2035.
The consumption is estimated to reach a volume of about 129.14 Million Tons by 2035.
The major drivers of the industry are rising disposable incomes, increasing population, rising production as well as consumption of processed tomatoes, growing consumption of processed foods, increasing adoption of the product by restaurants and fast food chains, and the rising organised retail sector of the product.
The health benefits of processed tomatoes, combined with their longer shelf life, is expected to be a key trend guiding the growth of the market.
North America, Europe, the Asia Pacific, Latin America, and the Middle East and Africa are the leading regions in the global tomato processing market.
The leading distribution channels in the market are supermarkets and hypermarkets, convenience stores, specialty stores, and online stores, among others.
The sauce sector accounts for the largest market share, among other end-use segments in the market.
The leading players in the global tomato processing market are Campbell Soup Company, J.G. Boswell Tomato Company, Chumak Company, Morning Star Company, and CONESA Group, among others.
Explore our key highlights of the report and gain a concise overview of key findings, trends, and actionable insights that will empower your strategic decisions.
| REPORT FEATURES | DETAILS |
| Base Year | 2025 |
| Historical Period | 2019-2025 |
| Forecast Period | 2026-2035 |
| Scope of the Report |
Historical and Forecast Trends, Industry Drivers and Constraints, Historical and Forecast Market Analysis by Segment:
|
| Breakup by Distribution Channel |
|
| Breakup by End Use |
|
| Breakup by Region |
|
| Market Dynamics |
|
| Competitive Landscape |
|
| Companies Covered |
|
| Report Price and Purchase Option | Explore our purchase options that are best suited to your resources and industry needs. |
| Delivery Format | Delivered as an attached PDF and Excel through email, with an option of receiving an editable PPT, according to the purchase option. |
Datasheet
One User
USD 2,499
USD 2,249
tax inclusive*
Single User License
One User
USD 3,999
USD 3,599
tax inclusive*
Five User License
Five User
USD 4,999
USD 4,249
tax inclusive*
Corporate License
Unlimited Users
USD 5,999
USD 5,099
tax inclusive*
*Please note that the prices mentioned below are starting prices for each bundle type. Kindly contact our team for further details.*
Flash Bundle
Small Business Bundle
Growth Bundle
Enterprise Bundle
*Please note that the prices mentioned below are starting prices for each bundle type. Kindly contact our team for further details.*
Flash Bundle
Number of Reports: 3
20%
tax inclusive*
Small Business Bundle
Number of Reports: 5
25%
tax inclusive*
Growth Bundle
Number of Reports: 8
30%
tax inclusive*
Enterprise Bundle
Number of Reports: 10
35%
tax inclusive*
How To Order

Select License Type
Choose the right license for your needs and access rights.

Click on ‘Buy Now’
Add the report to your cart with one click and proceed to register.

Select Mode of Payment
Choose a payment option for a secure checkout. You will be redirected accordingly.
Gain insights to stay ahead and seize opportunities.

Get insights & trends for a competitive edge.

Track prices with detailed trend reports.

Analyse trade data for supply chain insights.

Leverage cost reports for smart savings

Enhance supply chain with partnerships.

Connect For More Information
Our expert team of analysts will offer full support and resolve any queries regarding the report, before and after the purchase.
Our expert team of analysts will offer full support and resolve any queries regarding the report, before and after the purchase.
We employ meticulous research methods, blending advanced analytics and expert insights to deliver accurate, actionable industry intelligence, staying ahead of competitors.
Our skilled analysts offer unparalleled competitive advantage with detailed insights on current and emerging markets, ensuring your strategic edge.
We offer an in-depth yet simplified presentation of industry insights and analysis to meet your specific requirements effectively.


Share