

Consumer Insights
Uncover trends and behaviors shaping consumer choices today
Procurement Insights
Optimize your sourcing strategy with key market data
Industry Stats
Stay ahead with the latest trends and market analysis.

The global smart TV market size USD 269.08 Billion in 2025 and is projected to expand at a CAGR of 9.60% through 2035. The market is further expected to achieve USD 672.96 Billion by 2035. Growing integration of cross-device ecosystems, where Smart TVs sync with wearables, smart speakers, and home automation platforms, is rapidly boosting demand, as brands focus on unified interfaces and seamless multi-screen media continuity.
The industry witnesses an increasing number of manufacturers competing to merge display innovation with computing-grade performance. In May 2025, Samsung unveiled its AI-powered Neo QLED line, integrating on-device generative AI upscaling designed to enhance lower-resolution content in real time. This development aligns with a rising trend in the smart TV market, creating pressure for TVs that optimize bandwidth use while preserving clarity. Telecom operators and OTT ecosystem partners view this as a strategic breakthrough because AI-driven optimization reduces network strain while upgrading user experience.
Moreover, suppliers are inclining toward platform-centric models that treat Smart TVs as long-life digital hubs. Brands are embedding multi-mode processors, universal OS compatibility layers, and secure app ecosystems that help expand recurring revenue from content marketplaces and advertising inventories. In September 2025, Kodak expanded its Matrix Series with new QLED Google TVs, available in four sizes including 43, 50, 55, and 65 inches, driving demand in the smart TV market. Commercial clients, like hospitality chains and digital signage integrators, are adopting these enhanced platforms to speed up content deployment, minimize maintenance, and tap analytics for behavioral insights.
Base Year
Historical Period
Forecast Period
Advancements in display technologies like LED, OLED, and QLED have significantly enhanced the picture quality of flat TVs.
Android-based smart TVs are gaining prominence as many users are familiar with the Android interface as a result of increased penetration of Android smartphones.
There is a noticeable shift in consumer preference towards larger screens and smart features that enhance the user experience.
Compound Annual Growth Rate
9.6%
Value in USD Billion
2026-2035
*this image is indicative*
Industry dynamics are being reshaped by the rapid adoption of on-device AI processors that perform real-time upscaling, scene-level optimization, and personalized content recommendations. Companies like Samsung, LG, and TCL have introduced AI picture engines that reduce bandwidth consumption while improving clarity for sub-HD content. In July 2025, LG Electronics India introduced OLEDevo and QNEDevo TV lineup, featuring AI-powered personalization and the Alpha AI Processor Gen2. These smart TVs offer tailored viewing experiences with intelligent content recommendations, impacting the overall smart TV market penetration. Government support for AI innovation, such as South Korea’s AI semiconductor incentives and China’s subsidies for smart home chipsets, are accelerating commercialization.
Smart TV adoption is surging as manufacturers push for OS ecosystems that offer cross-device continuity and predictable update cycles. The launch of Google TV expansions, LG’s webOS licensing to third-party OEMs, and Amazon’s Fire TV partnerships with regional brands demonstrate how OS-driven scale is now central to competitive strategies. In May 2025, Toshiba broadened its smart TV offerings in India with a new gaming TV, expected to feature the AI-enhanced REGZA Engine ZRi for optimized picture. These OS ecosystems also give businesses like hotels, education providers, and retailers more stable deployment environments, allowing them to run custom apps, digital signage modules, and analytics dashboards with much lower integration friction. Governments encouraging open-source digital standards, for example, India’s BharatOS initiatives and EU pushes for interoperability, are supporting wider platform adoption, accelerating demand in the smart TV market.
Sustainability is becoming a competitive lever as brands face rising regulatory pressure around electronic waste. Manufacturers like Sony and Philips are adopting recycled plastics, halogen-free circuit boards, and lower-power chipsets to meet EU Ecodesign and Energy Label rules. In December 2024, Reliance Retail launched a range of six indigenously-developed, made-for-India Home Theatre LED televisions in partnership with audio equipment specialist, HARMAN, redefining the smart TV market dynamics. The introduction of modular TV parts, repairable backlight kits, and recyclable packaging materials enhances supplier differentiation.
Smart TVs are evolving into control centers for connected homes as brands integrate multi-device orchestration features. Apple, Samsung, and Google are embedding Matter-compatible hubs inside Smart TVs, enabling seamless syncing with lighting, HVAC systems, security devices, and wearables, reshaping the smart TV market trends. In September 2025, Samsung launched 'AI Home,' a new concept that creates a connected and intuitive living space by integrating intelligence across appliances, devices, and services. Telecom operators and OTT players leverage these integration features to bundle TV hardware with broadband, home security, and cloud gaming services.
Display innovation remains a core motivator of the smart TV market growth, with companies launching Mini-LED backlighting, quantum-dot enhancement layers, and early-generation Micro-LED systems for premium applications. TCL and Hisense are aggressively scaling Mini-LED capacity, while Samsung continues refining Micro-LED yields for commercial signage and ultra-premium consumer segments. In August 2025, Panasonic launched its new P series TV range including its flagship ShinobiPro mini-LED range in India. Governments supporting semiconductor and display fabrication, such as United States CHIPS Act incentives and China’s panel manufacturing subsidies, are accelerating mass-market adoption.
Smart TV industry share is increasingly influenced by a dual-track strategy adopted by manufacturers, where affordability-driven models coexist with premium performance offerings. Budget and mid-range launches from brands like Sharp, Thomson, and Lumio are accelerating adoption of technologies such as Mini-LED and QLED, especially in cost-sensitive markets like India and parts of Europe. These launches enable brands to attract first-time buyers and value-conscious upgraders, helping expand unit volumes and strengthen presence in the mid-tier smart TV segment.
In contrast, premium offerings like Sony’s Bravia 8 II QD-QLED series focus on sustaining share through technological leadership and brand loyalty. Advanced processors, enhanced audio integration, and cinema-grade visual features support higher average selling prices and reinforce Sony’s position in the high-end segment. Together, these approaches indicate a competitive smart TV market where market share shifts are shaped by price accessibility, display innovation, and localized product strategies.
Read more about this report - REQUEST FREE SAMPLE COPY IN PDF
The EMR’s report titled “Global Smart TV Market Report and Forecast 2026-2035” offers a detailed analysis of the market based on the following segments:
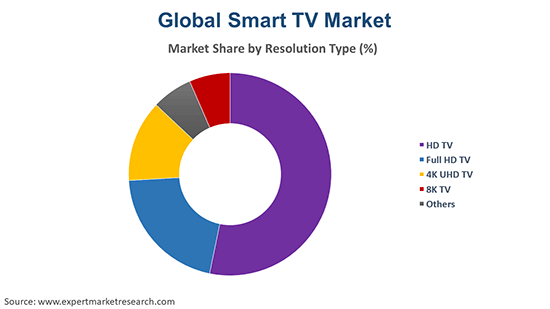
Market Breakup by Resolution Type
Key Insight: The smart TV market report classifies resolutions in a way that supports both older system compatibility and emerging performance needs across consumer and commercial sectors. HD and Full HD remain relevant in low-cost, secondary displays and retrofit projects, while 4K retains its relevance in enterprise deployments due to efficient content pipelines and serviceability. 8K is carving niche use cases in premium venues, cinema-grade signage, and retail flagships where visual distinction commands higher budgets.
Market Breakup by Screen Size
Key Insight: Screen size preferences vary based on deployment needs, space constraints, and content strategies. Below 32-inch and 32–45-inch displays remain relevant for secondary rooms, basic signage, and cost-centered projects. The 46–55-inch category dominates the smart TV market due to balanced performance and broad compatibility with 4K workflows, while larger 56–65-inch displays support more immersive use cases. Above 65-inch screens are expanding their shares as enterprises and premium households demand greater visual impact.
Market Breakup by Screen Type
Key Insight: Screen type selection depends on user experience goals, installation environments, and hardware compatibility. Flat screens remain the dominant format because they deliver consistent performance, simplified installation, and strong price-to-value ratios, propelling the smart TV market growth. Curved screens, though more niche, are gaining traction as premium households and entertainment-focused spaces seek deeper immersion and high-contrast engagement.
Market Breakup by Screen Technology
Key Insight: Screen technology choices are driven by performance expectations, installation environments, and long-term operating costs. LED remains the dominant technology because it offers a flexible combination of efficiency, affordability, and strong brightness across mainstream and commercial deployments. OLED is gaining momentum quickly as premium consumers and specialty installations value its unmatched contrast and color precision, redefining the smart TV market trends and dynamics. Other technologies like LCD and QLED contribute to niche or mid-range categories but remain secondary in scale.
Market Breakup by Platform
Key Insight: Platform selection in smart TVs is shaped by ecosystem richness, update frequency, and device compatibility. Android remains the dominant option in the smart TV market scope because of its open ecosystem, extensive app availability, and customizability that align well with mass-market and operator-driven deployments. WebOS is emerging at an accelerated pace due to its fluid UI, strong AI integrations, and expanding licensing models. Other platforms like Tizen, Roku, and MyHomeScreen address region-specific or niche use cases, but their growth is comparatively measured.
Market Breakup by Distribution Channel
Key Insight: Offline and online channels both shape the competitive landscape of the smart TV market, each influenced by distinct buying behaviors. Offline retail leads the market due to experiential evaluation, knowledgeable staff, and bundled installation support that appeals to shoppers seeking confidence in high-value electronics. Online channels, however, are becoming more popular due to transparent pricing, reliable delivery infrastructure, and detailed customer reviews.
Market Breakup by Application
Key Insight: Residential and commercial sectors both contribute to the smart TV market expansion. Residential buyers lead adoption as households embrace streaming ecosystems, gaming features, and connected home integrations. The commercial sector’s growth is driven by hotels, retailers, and offices that incorporate large-format smart displays for guest engagement, signage, and collaboration. While residential demand centers on entertainment and affordability, commercial demand focuses on durability, remote management, and content control.
Market Breakup by Region
Key Insight: All major regions contribute to the smart TV market revenue growth. Asia Pacific leads in terms of manufacturing strength, affordability, and rapid digital access, making it the volume center for global shipments. North America grows its shares due to strong consumer spending, premium screen preferences, and connected home expansion. Europe benefits from rising energy-efficient models and steady replacement cycles, while Latin America and the Middle East & Africa gradually scale adoption as streaming availability widens.
By resolution type, 4K UHD is leading the market due to cost-performance
4K UHD panels are the dominant commercial choice due to optimal cost-to-performance balance, enabling broadcasters and hospitality integrators to deliver crisp imagery. OEMs are focusing on panels with hardware HDR processing, variable refresh rates, and AI-enhanced upscaling to maximize perceived quality for streamed content. In July 2025, Samsung South Africa announced the availability of its 2025 Samsung 8K and 4K Neo QLED Mini LED series.
The 8K resolution category, driven by premium venue installations, broadcast upgrades, and flagship retail experiences, is driving growth in the smart TV market by a huge margin. Major panel makers are releasing reference designs with dedicated upscaling ASICs and increased bit-depth to serve cinematic playback and pro-AV workflows. Despite high costs, integrators are adopting 8K for short-run installations where visual differentiation is favored over higher budgets.
By screen size, 46–55 inch displays secure the largest market share owing to versatile deployment and strong content compatibility
The 46–55 inch category dominates the market because it fits both residential living rooms and commercial deployments without heavy installation constraints. Manufacturers are refining bezel-less formats, adaptive refresh management, and SoC-based processing to serve retailers, hospitality chains, and enterprise huddle rooms. In March 2023, Westinghouse TV, a United States-based consumer electronics company, launched 24-inch, 40-inch, and 55-inch TV models in India. Display makers are also integrating commercial-grade firmware tools, secure remote device management, and improved panel durability to support multi-location installations, accelerating the smart TV industry revenue growth.
Growth in the 65-inch display category is driven by premium home theatre adoption, corporate experience centers, and high-impact retail signage. Panel producers are prioritizing advanced contrast enhancement layers, wide-gamut color, and high brightness modules suited for bright indoor environments.
By screen type, flat screen TVs register the largest share of the market due to broad compatibility and efficient manufacturing
Flat screens dominate the market because they provide a reliable, cost-efficient architecture that suits both mainstream households and institutional deployments. Manufacturers prioritize flat panels when rolling out new SoC processors, upgraded HDR tuning, and energy-efficient backlight systems, allowing them to scale innovations at volume without introducing supply chain complexity.
Curved displays witness accelerated growth in the smart TV market shares as specialized gaming zones, high-end living rooms, and simulation environments demand more immersive focal depth. Manufacturers are refining curvature radii, peripheral contrast stability, and multi-angle viewing to reduce distortion while enhancing engagement for premium content. Curved TVs also integrate advanced motion handling, high refresh panels, and enriched color mapping, which makes them attractive for enthusiast buyers and boutique commercial installations.
By screen technology, LED technology secure significant market share owing to high efficiency and broad market availability
LED technology secures the dominant market position because manufacturers can optimize it for nearly every price band while maintaining strong brightness, low power consumption, and reliable thermal behavior. OEMs scale LED production rapidly, owing to mature backlight assembly lines, allowing them to release frequent firmware upgrades, improved dimming algorithms, and refined HDR performance with minimal redesign. In August 2025, Blaupunkt launched its premium Mini LED smart TVs in India, available exclusively on Flipkart, responding to the demand in the smart TV market.
OLED represents the fastest-growing technology as premium buyers and commercial experiential spaces demand superior contrast, pixel-level illumination, and cinematic color reproduction. Manufacturers are accelerating R&D on burn-in mitigation, brightness boosters, and panel longevity, enabling OLED to secure broader adoption.
By platform, Android TV leads the market due to open ecosystem and broad developer support
Android TV dominates the platform category as vendors gain access to a mature open-source ecosystem, a massive library of applications, and Google-backed AI-driven content recommendations. Manufacturers prefer Android due to seamless integration with voice assistants, cross-device interoperability, and consistent security patches that reduce long-term maintenance burdens. In August 2025, Japanese AKAI launched Android PowerView Google TV series in India under INR 15000.
WebOS is the fastest-growing platform in the smart TV industry dynamics because it delivers a polished, intuitive interface optimized for smooth navigation and quick content switching, appealing strongly to premium and mid-range consumers. LG’s continuous investment in AI-enhanced picture personalization, cross-platform ThinQ integrations, and low-latency gaming modes has strengthened WebOS’s competitive edge. The OS’s modular architecture enables faster onboarding of new streaming services, while partnerships with global content providers expand regional relevance.
Offline retail secures the largest share of the market owing to high touchpoint value and trust
Offline retail remains the dominant distribution channel in the smart TV market because consumers still rely heavily on in-store evaluation, especially for large-format smart TVs where picture quality, brightness, and panel uniformity matter. Retailers create experiential zones that allow side-by-side comparisons, enabling buyers to validate HDR performance, audio clarity, and motion handling before committing. Big-box retailers and specialized electronics chains continue to influence purchasing decisions through trained sales personnel who explain platform differences, energy-efficiency labels, and connectivity features.
Online channels are the fastest-growing distribution channel accelerating the smart TV market value as consumers increasingly trust digital platforms for transparent pricing, quick delivery, and expansive product choice. E-commerce marketplaces list multiple models with detailed specifications, verified reviews, and comparison tools, helping buyers make informed decisions remotely. Direct-to-consumer portals from manufacturers further strengthen this channel by offering assured authenticity, customization options, and priority installation slots.
Residential applications accelerate the market growth with rapid upgrade cycles and connected home adoption
The residential category dominates as households continue upgrading to larger, higher-resolution displays that complement streaming lifestyles. Consumers increasingly prioritize smart connectivity, voice-enabled assistants, and multi-platform compatibility, pushing brands to integrate faster processors, low-latency modes, and AI-based picture tuning for living-room entertainment. In September 2025, Dish TV launched its VZY Smart TVs lineup in India, offering built-in DTH and OTT streaming across sizes ranging from 32-inch HD to 55-inch displays.
Hospitality chains, retail environments, coworking spaces, and corporate campuses adopt advanced smart displays to enhance digital engagement, augmenting growth of the commercial sector’s share in the smart TV market revenue. Hotels deploy large-format smart TVs with customized OS layers for contactless guest services and centralized content management. Retailers incorporate UHD displays for dynamic signage, interactive promotions, and contextual advertising. Workplaces use smart TVs to enable seamless conferencing, wireless casting, and real-time collaboration.


Asia Pacific clocks in the largest market share owing to expanding middle-class demand and aggressive local manufacturing
Asia Pacific dominates the smart TV market, supported by massive production ecosystems, competitive pricing models, and rising digital adoption across emerging economies. China, South Korea, Japan, and India boast strong manufacturing clusters producing LED, OLED, and QLED panels at scale. Regional brands like Xiaomi, Hisense, TCL, and OnePlus push aggressive innovation cycles, introducing AI-driven picture processors and integrated smart home hubs.
The smart TV market in North America is powered by strong replacement cycles, premium screen adoption, and the region’s demand for high-end smart ecosystems. Consumers increasingly prefer 55-inch and larger TVs equipped with advanced processors, mini-LED backlighting, and 120Hz+ motion handling for gaming and streaming. Brands benefit from widespread penetration of 4K and accelerating 8K interest, supported by robust OTT service expansion.
Prominent smart TV market players are investing in proprietary AI upscalers, HDR pipelines, and integrated edge-AI for personalized recommendations. OEMs are packaging these features as SaaS-style subscriptions to improve margins. Chipmakers are offering turnkey SoCs with neural processing to reduce time-to-market, while panel makers are introducing miniLED and hybrid QD stacks for better contrast at competitive prices. Retail and telco partners are co-designing financing and bundled OTT offers to accelerate replacement cycles.
Logistics and aftersales are becoming differentiators such as modular repairable panels and field-replaceable compute modules are lowering TCO for enterprise customers. Opportunities can be found in gaming-grade low-latency modes, B2B hospitality deployments with central device management, and regional localization of voice/UI. Smart TV companies that combine flexible hardware roadmaps with platform services are winning long-term contracts and recurring revenue.
Samsung, founded as a trading company in 1969 and now headquartered in Suwon, South Korea, is pushing image-processing leadership through Neural Quantum Processors and personalized ambient experiences. The firm is integrating advanced miniLED and QD-enhanced panels with multi-mic far-field voice and edge AI for in-screen assistants.
LG, established in South Korea and established in the year 1958, is leveraging OLED technology and webOS platform to differentiate on picture fidelity and developer integrations. LG is shipping self-emissive panels with advanced burn-in mitigation, immersive audio arrays, and proprietary Alpha image processors optimized for color-critical workflows.
Apple, headquartered in the United States and founded in 1976, is extending TV services into the premium living-room space emphasizing privacy, ecosystem continuity, and app monetization. Apple TV offerings are being paired with advanced display partnerships and an emphasis on secure multiuser profiles, spatial audio, and cross-device Handoff.
Founded in 1918 and headquartered in India, Panasonic India is focusing on durable commercial panels and localized smart TV experiences for Indian users, combining efficient IPS panels with region-specific platforms and certified OTT integrations. The company is partnering with telcos and retail chains to offer bundled content subscriptions and easy finance options for semi-urban buyers.
*Please note that this is only a partial list; the complete list of key players is available in the full report. Additionally, the list of key players can be customized to better suit your needs.*
Other key players in the market include Koninklijke Philips N.V., Sony Corporation, TCL, Haier Group Corporation, and Vizio Inc., among others.
Unlock the latest insights with our smart TV market trends 2026 report. Discover regional growth patterns, consumer preferences, and key industry players. Stay ahead of competition with trusted data and expert analysis. Download your free sample report today and drive informed decisions in the market.


Upto 15% Off
USD
$2499 $2249
$3999 $3599
$4999 $4249
$5999 $5099


*While we strive to always give you current and accurate information, the numbers depicted on the website are indicative and may differ from the actual numbers in the main report. At Expert Market Research, we aim to bring you the latest insights and trends in the market. Using our analyses and forecasts, stakeholders can understand the market dynamics, navigate challenges, and capitalize on opportunities to make data-driven strategic decisions.*
Get in touch with us for a customized solution tailored to your unique requirements and save upto 35%!
In 2025, the market reached an approximate value of USD 269.08 Billion.
The market is projected to grow at a CAGR of 9.60% between 2026 and 2035.
The market is estimated to witness a healthy growth in the forecast period of 2026-2035 to reach about USD 672.96 Billion by 2035.
Developing modular upgradeable hardware, partnering with regional OTT and telco bundles, offering managed device fleets, and integrating edge AI services to monetize personalized viewing and enterprise solutions are some of the key strategies observed in the market.
The key market trend guiding the growth of the smart TV market include the increased acceptance of 4K resolution televisions.
The major regions in the market are North America, Latin America, the Middle East and Africa, Europe, and the Asia Pacific.
HD TV, Full HD TV, 4K UHD TV, and 8K TV, among others are the major resolution types of the product in the market.
The major screen sizes of the product in the market include below 32 inches, 32 to 45 inches, 46 to 55 inches, 56 to 65 inches, and above 65 inches, among others.
The significant screen types of the product in the market are flat and curved.
LCD (Liquid Crystal Display), LED (Light Emitting Diode), OLED (Organic Light Emitting Diode), and QLED (Quantum Dot Light Emitting Diode) are the significant screen technology segments of the product in the market.
Android, Roku, WebOS, Tizen OS, iOS, and MyHomeScreen, among others, are the significant platforms of the product in the market.
Offline and online are the major distribution channels of the product in the market.
Residential and commercial applications are the major application segments of the product in the market.
The key players in the market include Samsung Electronics Co., Ltd., LG Electronics, Apple Inc., Panasonic India, Koninklijke Philips N.V., Sony Corporation, TCL, Haier Group Corporation, Vizio Inc., and others.
Component shortages, panel commoditization, and platform fragmentation are increasing costs and slowing innovation, while regulatory privacy rules and fragmented regional OTT ecosystems complicate global go-to-market strategies.
Explore our key highlights of the report and gain a concise overview of key findings, trends, and actionable insights that will empower your strategic decisions.
| REPORT FEATURES | DETAILS |
| Base Year | 2025 |
| Historical Period | 2019-2025 |
| Forecast Period | 2026-2035 |
| Scope of the Report |
Historical and Forecast Trends, Industry Drivers and Constraints, Historical and Forecast Market Analysis by Segment:
|
| Breakup by Resolution Type |
|
| Breakup by Screen Size |
|
| Breakup by Screen Type |
|
| Breakup by Screen Technology |
|
| Breakup by Platform |
|
| Breakup by Distribution Channel |
|
| Breakup by Application |
|
| Breakup by Region |
|
| Market Dynamics |
|
| Competitive Landscape |
|
| Companies Covered |
|
| Report Price and Purchase Option | Explore our purchase options that are best suited to your resources and industry needs. |
| Delivery Format | Delivered as an attached PDF and Excel through email, with an option of receiving an editable PPT, according to the purchase option. |
Datasheet
One User
USD 2,499
USD 2,249
tax inclusive*
Single User License
One User
USD 3,999
USD 3,599
tax inclusive*
Five User License
Five User
USD 4,999
USD 4,249
tax inclusive*
Corporate License
Unlimited Users
USD 5,999
USD 5,099
tax inclusive*
*Please note that the prices mentioned below are starting prices for each bundle type. Kindly contact our team for further details.*
Flash Bundle
Small Business Bundle
Growth Bundle
Enterprise Bundle
*Please note that the prices mentioned below are starting prices for each bundle type. Kindly contact our team for further details.*
Flash Bundle
Number of Reports: 3
20%
tax inclusive*
Small Business Bundle
Number of Reports: 5
25%
tax inclusive*
Growth Bundle
Number of Reports: 8
30%
tax inclusive*
Enterprise Bundle
Number of Reports: 10
35%
tax inclusive*
How To Order

Select License Type
Choose the right license for your needs and access rights.

Click on ‘Buy Now’
Add the report to your cart with one click and proceed to register.

Select Mode of Payment
Choose a payment option for a secure checkout. You will be redirected accordingly.
Gain insights to stay ahead and seize opportunities.

Get insights & trends for a competitive edge.

Track prices with detailed trend reports.

Analyse trade data for supply chain insights.

Leverage cost reports for smart savings

Enhance supply chain with partnerships.

Connect For More Information
Our expert team of analysts will offer full support and resolve any queries regarding the report, before and after the purchase.
Our expert team of analysts will offer full support and resolve any queries regarding the report, before and after the purchase.
We employ meticulous research methods, blending advanced analytics and expert insights to deliver accurate, actionable industry intelligence, staying ahead of competitors.
Our skilled analysts offer unparalleled competitive advantage with detailed insights on current and emerging markets, ensuring your strategic edge.
We offer an in-depth yet simplified presentation of industry insights and analysis to meet your specific requirements effectively.


Share