

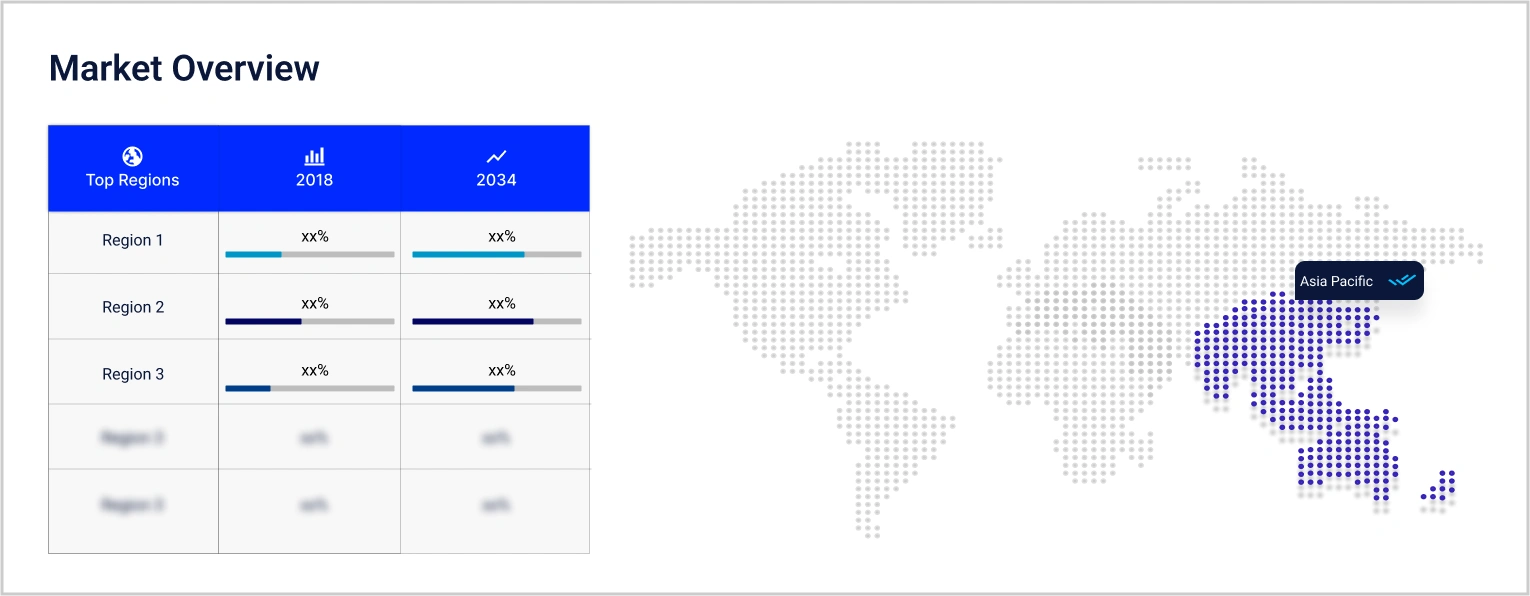
Consumer Insights
Uncover trends and behaviors shaping consumer choices today
Procurement Insights
Optimize your sourcing strategy with key market data
Industry Stats
Stay ahead with the latest trends and market analysis.
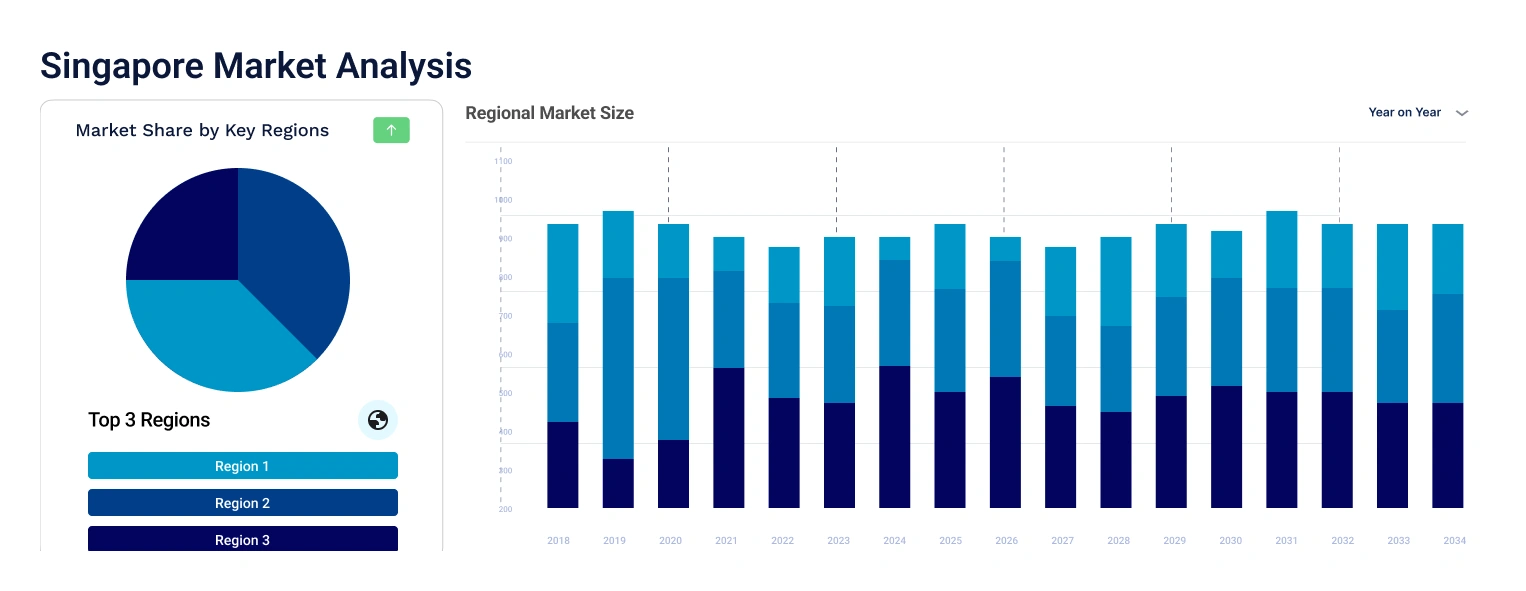
The Singapore television market reached around USD 136.45 Million in 2024. The market is projected to grow at a CAGR of 3.60% between 2025 and 2034, reaching almost USD 194.34 Million by 2034.
Base Year
Historical Year
Forecast Year
In 2021, audience viewership on OTT platforms recorded a y-o-y growth of 27%, reaching over one billion.
In 2021, an average person from Singapore spent nearly 2 hours watching television daily.
The rise of work-from-home culture and home entertainment is expected to drive the market growth further.


Value in USD Million
2025-2034
Singapore Television Market Outlook
*this image is indicative*
In 2020, an average person from Singapore spent 1.8 hours watching television daily. The older generations prefer using traditional TV sets to watch international shows dubbed in their language.
With the advent of smart TVs, consumers’ access to both broadcasted and streaming content has improved significantly, which has led to a substantial increase in television viewing time. Many genres, including South Korean dramas, have become increasingly popular among the younger generations, contributing towards increasing sales of smart TVs.
The Infocomm Media Development Authority of Singapore is expected to introduce a television audience measurement system, which can measure the time spent by consumers on watching various TV programs across different devices. This is expected to enable broadcasters to create personalised TV shows for the audience by analysing their preferences for different genres. Consumers are also expected to benefit from targeted advertising strategies, which suggest products tailored to their specific issues or problems.
Television broadcasting companies are expected to bolster their partnerships with streaming service providers to provide a bundle of OTT platforms to consumers cost-effectively. This is expected to save consumers money while driving the growth of the market over the forecast period.
Singapore Television Market Report and Forecast 2025-2034 offers a detailed analysis of the market based on the following segments:
Market Breakup by Type:
Market Breakup by Distribution Channel:
Based on the distribution channel, the market is divided into online and offline. Over the forecast period, online distribution channels are expected to remain the key market segment. As of 2022, there were 3.51 million people using e-commerce in Singapore, which is expected to sustain over the forecast period, driven by rising smartphone penetration rates and increasing internet accessibility.
Key market players are focusing on introducing innovative designs of linear televisions into the market. Besides, the rapid growth in consumption of OTT content is increasing the demand for connected TVs.
*While we strive to always give you current and accurate information, the numbers depicted on the website are indicative and may differ from the actual numbers in the main report. At Expert Market Research, we aim to bring you the latest insights and trends in the market. Using our analyses and forecasts, stakeholders can understand the market dynamics, navigate challenges, and capitalize on opportunities to make data-driven strategic decisions.*
Get in touch with us for a customized solution tailored to your unique requirements and save upto 35%!
The market reached nearly USD 136.45 Million in 2024.
The market is projected to grow at a CAGR of 3.60% between 2025 and 2034.
The market is assessed to witness a healthy growth in the forecast period to reach around USD 194.34 Million in 2034.
The different types of televisions in the market include smart TV, LCD, plasma, and LED TVs, and cathode-ray tube (CRT) and rear-projection TVs.
The different distribution channels of television in the market include offline and online.
The key market players are Samsung Electronics Co., Ltd., LG Corp., Panasonic Holdings Corp., Sony Group Corp., Toshiba Corporation, Hisense International Co., Ltd., KONKA Group Co. Ltd., Prism Tech Private Limited, and Hon. Hai Precision Industry Co., Ltd. (Sharp Corp.), among others.
Explore our key highlights of the report and gain a concise overview of key findings, trends, and actionable insights that will empower your strategic decisions.
| REPORT FEATURES | DETAILS |
| Base Year | 2024 |
| Historical Period | 2018-2024 |
| Forecast Period | 2025-2034 |
| Scope of the Report |
Historical and Forecast Trends, Industry Drivers and Constraints, Historical and Forecast Market Analysis by Segment:
|
| Breakup by Type |
|
| Breakup by Distribution Channel |
|
| Market Dynamics |
|
| Competitive Landscape |
|
| Companies Covered |
|
Datasheet
One User
USD 2,499
USD 2,249
tax inclusive*
Single User License
One User
USD 3,999
USD 3,599
tax inclusive*
Five User License
Five User
USD 4,999
USD 4,249
tax inclusive*
Corporate License
Unlimited Users
USD 5,999
USD 5,099
tax inclusive*
*Please note that the prices mentioned below are starting prices for each bundle type. Kindly contact our team for further details.*
Flash Bundle
Small Business Bundle
Growth Bundle
Enterprise Bundle
*Please note that the prices mentioned below are starting prices for each bundle type. Kindly contact our team for further details.*
Flash Bundle
Number of Reports: 3
20%
tax inclusive*
Small Business Bundle
Number of Reports: 5
25%
tax inclusive*
Growth Bundle
Number of Reports: 8
30%
tax inclusive*
Enterprise Bundle
Number of Reports: 10
35%
tax inclusive*
How To Order
Our step-by-step guide will help you select, purchase, and access your reports swiftly, ensuring you get the information that drives your decisions, right when you need it.

Select License Type
Choose the right license for your needs and access rights.

Click on ‘Buy Now’
Add the report to your cart with one click and proceed to register.

Select Mode of Payment
Choose a payment option for a secure checkout. You will be redirected accordingly.
Gain insights to stay ahead and seize opportunities.

Get insights & trends for a competitive edge.

Track prices with detailed trend reports.

Analyse trade data for supply chain insights.

Leverage cost reports for smart savings

Enhance supply chain with partnerships.

Connect For More Information
Our expert team of analysts will offer full support and resolve any queries regarding the report, before and after the purchase.
Our expert team of analysts will offer full support and resolve any queries regarding the report, before and after the purchase.
We employ meticulous research methods, blending advanced analytics and expert insights to deliver accurate, actionable industry intelligence, staying ahead of competitors.
Our skilled analysts offer unparalleled competitive advantage with detailed insights on current and emerging markets, ensuring your strategic edge.
We offer an in-depth yet simplified presentation of industry insights and analysis to meet your specific requirements effectively.
Australia
63 Fiona Drive, Tamworth, NSW
+61-448-061-727
India
C130 Sector 2 Noida, Uttar Pradesh 201301
+91-723-689-1189
Philippines
40th Floor, PBCom Tower, 6795 Ayala Avenue Cor V.A Rufino St. Makati City,1226.
+63-287-899-028, +63-967-048-3306
United Kingdom
6 Gardner Place, Becketts Close, Feltham TW14 0BX, Greater London
+44-753-713-2163
United States
30 North Gould Street, Sheridan, WY 82801
+1-415-325-5166
Vietnam
193/26/4 St.no.6, Ward Binh Hung Hoa, Binh Tan District, Ho Chi Minh City
+84-865-399-124
United States (Head Office)
30 North Gould Street, Sheridan, WY 82801
+1-415-325-5166
Australia
63 Fiona Drive, Tamworth, NSW
+61-448-061-727
India
C130 Sector 2 Noida, Uttar Pradesh 201301
+91-723-689-1189
Philippines
40th Floor, PBCom Tower, 6795 Ayala Avenue Cor V.A Rufino St. Makati City, 1226.
+63-287-899-028, +63-967-048-3306
United Kingdom
6 Gardner Place, Becketts Close, Feltham TW14 0BX, Greater London
+44-753-713-2163
Vietnam
193/26/4 St.no.6, Ward Binh Hung Hoa, Binh Tan District, Ho Chi Minh City
+84-865-399-124


Share