

Consumer Insights
Uncover trends and behaviors shaping consumer choices today
Procurement Insights
Optimize your sourcing strategy with key market data
Industry Stats
Stay ahead with the latest trends and market analysis.
Trending Now


The global security market reached a value of approximately USD 377.38 Billion in 2024. The market is projected to grow at a CAGR of 7.30% between 2025 and 2034, reaching a value of around USD 763.44 Billion by 2034.
Base Year
Historical Year
Forecast Year
The global security services market includes over 20,000 companies, with security guard services playing a crucial role across various sectors.
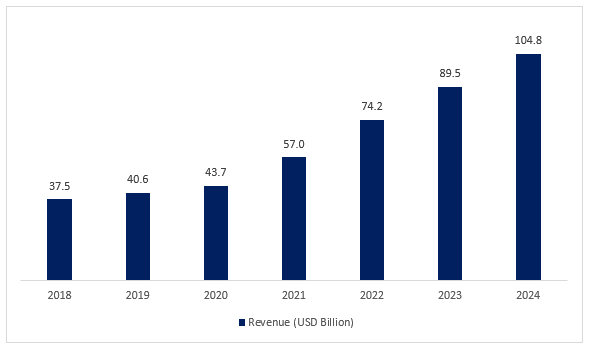
In 2023, smart cities generated a revenue of USD 89.49 billion globally, where video surveillance systems are widely used to improve the safety of people and assets.
ATG Access Limited, Barrier1 Systems, LLC, and Cias Elettronica Srl are a few of the major companies in the market.


Value in USD Billion
2025-2034
Security Market Outlook
*this image is indicative*
| Global Security Market Report Summary | Description | Value |
| Base Year | USD Billion | 2024 |
| Historical Period | USD Billion | 2018-2024 |
| Forecast Period | USD Billion | 2025-2034 |
| Market Size 2024 | USD Billion | 377.38 |
| Market Size 2034 | USD Billion | 763.44 |
| CAGR 2018-2024 | Percentage | XX% |
| CAGR 2025-2034 | Percentage | 7.30% |
| CAGR 2025-2034 - Market by Region | Asia Pacific | 8.4% |
| CAGR 2025-2034 - Market by Country | India | 9.7% |
| CAGR 2025-2034 - Market by Country | China | 8.1% |
| CAGR 2025-2034 - Market by Service | Managed Security Services | 8.0% |
| CAGR 2025-2034 - Market by Application | Government | 8.3% |
| Market Share by Country 2024 | India | 3.8% |
There is a growing demand for security systems that incorporate artificial intelligence (AI) to meet the needs of smart home solutions. During 2022, the number of smart homes in North America expanded by 12.0% year-on-year. By 2027, around 88.1 million homes in North America are expected to be smart, equal to 58% of all homes in the region.
Figure: Revenue Generated by Smart Cities Globally, USD Billion, 2018-2024 (E)
One of the factors driving the security market demand is the commercial sector, where efficient security systems like alarms and video surveillance are vital to safeguard customers and staff from theft and crime. By 2027, the global commercial real estate market is projected to reach USD 12.6 trillion.


Increased focus on improving security across various sectors, technological improvements, rising smart city projects, increased security threats, and the growing installation of CCTV cameras are the factors driving the global security market growth.
Security systems, such as video surveillance, barrier systems, and access control systems are becoming increasingly popular in sectors such as energy, service, automotive, and infrastructure.
The incorporation of artificial intelligence (AI) and machine learning algorithms, mobile credential systems, and data-informed occupancy management help optimise the existing security systems and improve the operation of both physical and digital security technologies.
Smart cities are increasingly incorporating intelligent video surveillance systems and emergency response systems that use real-time data to improve public safety in places such as schools, homes, and hospitals. In 2023, smart cities generated a revenue of USD 89.49 billion globally.
Businesses in end use markets are increasingly facing external physical security incidents, causing significant financial losses. In 2023, the average cost of a data breach reached an all-time high of USD 4.45 million, representing a 2.3% increase from the 2022 cost of USD 4.35 million. This rising security threats supports the demand for robust security measures and advanced technological solutions to protect organizations from these threats.
Artificial intelligence and cloud computing are important technology trends impacting the global security market. The rising security concerns and a renewed focus on infrastructure protection aid the adoption of physical security equipment such as video surveillance, physical access control, intruder alarms, and fire protection.
Furthermore, CCTV camera surveillance is widely popular globally to mitigate crimes and theft and enhance public protection. To meet the demand for advanced solutions, video surveillance companies are engaged in developing advanced solutions with cloud-based and data management capabilities. China has the largest number of installed cameras, globally. Chinese cities with over 1,00,000 CCTV cameras include Beijing (1,150,000) and Shanghai (1,000,000).
Read more about this report - REQUEST FREE SAMPLE COPY IN PDF
“Global Security Industry Report and Forecast 2025-2034” offers a detailed analysis of the market based on the following segments:
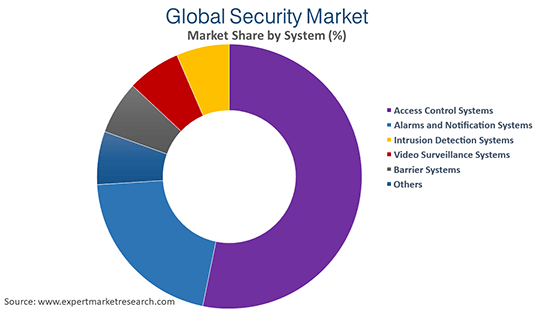
Market Breakup by System:
Market Breakup by Service:
Market Breakup by Application:
Market Breakup by Region:
By type, the services segment is expected to hold a significant market share, with rising crime rates driving businesses to invest in security guard services and other solutions
Cybersecurity services are being increasingly deployed with rising number of threats and security breaches. Also, the rise in infrastructure investments is creating a need to safeguard the assets and associated flows, accelerating the demand for security services. As of 2023, physical security market employs over 30 million people globally, majority of which are in guarding services.
Safety equipment includes security cameras, smoke and carbon monoxide detectors, door and window sensors, etc. Security equipment is a key factor in asset protection and for ensuring a safe living and workplace. By the end of 2021, about one billion surveillance cameras were reported to be in function across the globe.
Major market players are increasing their collaboration, partnership, and research and development activities to gain a competitive edge in the market
Headquartered in Germany and founded in 1951, the company offers a comprehensive range of high-security and access products, enhanced with advanced control systems. It has an extensive range of high-security and access products enhanced with smart control systems, which includes sliding gates, quick folding gates, bollards, road blockers, barriers, and turnstiles.
Headquartered in UK and founded in 1989, ATG Access Ltd is one of the UK's leading security engineering companies, providing physical security solutions for sites around the world. The company offers residential solutions, commercial solutions, and traffic management.
Headquartered in the United States and founded in 2006, the company provides a custom range of American-made vehicle barrier systems, trusted by top security professionals globally. It offers high security bollards, crash beams and drop arms, patented net barriers, and other security equipment.
Headquartered in the Italy and founded in 1974, Cias Elettronica offers cutting-edge microwave, infrared, and triple-technology barriers, as well as advanced fence detection systems.
*Please note that this is only a partial list; the complete list of key players is available in the full report. Additionally, the list of key players can be customized to better suit your needs.*
Other key players in the global security market include Delta Scientific Corporation, Hangzhou Hikvision Digital Technology Co., Ltd., Zhejiang Dahua Technology Co. Ltd., ASSA ABLOY AB, and Motorola Solutions, Inc.
Asia Pacific is a prominent region due to the rising cyber-attacks and CCTV installations in leading Asian economies.
Asia-Pacific accounted for 31% of all cyber-attacks in 2022, the highest globally. As of 2023, key APAC countries with the most CCTV cameras installed include China (200 million), Japan (5 million), Vietnam (2.6 million), and South Korea (over 1 million).
| CAGR 2025-2034 - Market by | Country |
| India | 9.7% |
| China | 8.1% |
| UK | 6.7% |
| USA | 6.5% |
| France | 5.7% |
| Canada | XX% |
| Germany | XX% |
| Italy | XX% |
| Japan | 5.0% |
| Australia | XX% |
| Saudi Arabia | XX% |
| Brazil | XX% |
| Mexico | XX% |
In Europe, as of 2023, London, Berlin, Warsaw, and Vienna, are among the top cities in Europe, in terms of the number of CCTVs. In 2022, Europe had 311.3 million mobile IoT connections Western Europe including, France and Germany, had around 20 to 60 million connected devices.
In North America, by the end of 2022, an estimated 34.8 million active monitored alarm systems were reported in the United States and Canada. As of 2022, 85.6% of the security guards work in the private sector in the United States, and 14.4% in the public sector.
*While we strive to always give you current and accurate information, the numbers depicted on the website are indicative and may differ from the actual numbers in the main report. At Expert Market Research, we aim to bring you the latest insights and trends in the market. Using our analyses and forecasts, stakeholders can understand the market dynamics, navigate challenges, and capitalize on opportunities to make data-driven strategic decisions.*
Get in touch with us for a customized solution tailored to your unique requirements and save upto 35%!
In 2024, the global security market value was USD 377.38 Billion.
The market is expected to grow at a CAGR of 7.30% between 2025 and 2034.
The market is estimated to witness a healthy growth in the forecast period of 2025-2034 to reach USD 763.44 Billion by 2034.
The major drivers include increase in cyber attacks, development of industrial sector, and CCTV adoption in prominent economies globally.
The key trends include the growth in smart city projects along with smart home adoption.
The major regions in the market are North America, Latin America, the Middle East and Africa, Europe, and the Asia Pacific.
The systems of security available are access control systems, intrusion detection systems, video surveillance systems, and barrier systems, amongst others.
Major applications include government, residential, transportation, commercial, industrial, and others.
By service, the market is categorised into system integration and consulting, risk assessment and analysis, managed security services, and maintenance and support.
The major players in the market include ATG Access Limited, Barrier1 Systems, LLC, Cias Elettronica Srlare, Perimeter Protection Germany GmbH, Delta Scientific Corporation, Hangzhou Hikvision Digital Technology Co., Ltd., Zhejiang Dahua Technology Co. Ltd., ASSA ABLOY AB, and Motorola Solutions, Inc.
The different types of security include equipment and services.
Explore our key highlights of the report and gain a concise overview of key findings, trends, and actionable insights that will empower your strategic decisions.
| REPORT FEATURES | DETAILS |
| Base Year | 2024 |
| Historical Period | 2018-2024 |
| Forecast Period | 2025-2034 |
| Scope of the Report |
Historical and Forecast Trends, Industry Drivers and Constraints, Historical and Forecast Market Analysis by Segment:
|
| Breakup by System |
|
| Breakup by Service |
|
| Breakup by Application |
|
| Breakup by Region |
|
| Market Dynamics |
|
| Competitive Landscape |
|
| Companies Covered |
|
Single User License
One User
USD 3,999
USD 3,599
tax inclusive*
Datasheet
One User
USD 2,499
USD 2,249
tax inclusive*
Five User License
Five User
USD 4,999
USD 4,249
tax inclusive*
Corporate License
Unlimited Users
USD 5,999
USD 5,099
tax inclusive*
*Please note that the prices mentioned below are starting prices for each bundle type. Kindly contact our team for further details.*
Flash Bundle
Small Business Bundle
Growth Bundle
Enterprise Bundle
*Please note that the prices mentioned below are starting prices for each bundle type. Kindly contact our team for further details.*
Flash Bundle
Number of Reports: 3
20%
tax inclusive*
Small Business Bundle
Number of Reports: 5
25%
tax inclusive*
Growth Bundle
Number of Reports: 8
30%
tax inclusive*
Enterprise Bundle
Number of Reports: 10
35%
tax inclusive*
How To Order
Our step-by-step guide will help you select, purchase, and access your reports swiftly, ensuring you get the information that drives your decisions, right when you need it.

Select License Type
Choose the right license for your needs and access rights.

Click on ‘Buy Now’
Add the report to your cart with one click and proceed to register.

Select Mode of Payment
Choose a payment option for a secure checkout. You will be redirected accordingly.
Track prices with detailed trend reports.

Analyse trade data for supply chain insights.

Leverage cost reports for smart savings

Enhance supply chain with partnerships.

Gain insights to stay ahead and seize opportunities.

Get insights & trends for a competitive edge.

Track prices with detailed trend reports.
Analyse trade data for supply chain insights.
Leverage cost reports for smart savings
Enhance supply chain with partnerships.
Gain insights to stay ahead and seize opportunities.
Get insights & trends for a competitive edge.
Track prices with detailed trend reports.
Analyse trade data for supply chain insights.
Connect For More Information
Our expert team of analysts will offer full support and resolve any queries regarding the report, before and after the purchase.
Our expert team of analysts will offer full support and resolve any queries regarding the report, before and after the purchase.
We employ meticulous research methods, blending advanced analytics and expert insights to deliver accurate, actionable industry intelligence, staying ahead of competitors.
Our skilled analysts offer unparalleled competitive advantage with detailed insights on current and emerging markets, ensuring your strategic edge.
We offer an in-depth yet simplified presentation of industry insights and analysis to meet your specific requirements effectively.
Australia
63 Fiona Drive, Tamworth, NSW
+61-448-061-727
India
C130 Sector 2 Noida, Uttar Pradesh 201301
+91-723-689-1189
Philippines
40th Floor, PBCom Tower, 6795 Ayala Avenue Cor V.A Rufino St. Makati City,1226.
+63-287-899-028, +63-967-048-3306
United Kingdom
6 Gardner Place, Becketts Close, Feltham TW14 0BX, Greater London
+44-753-713-2163
United States
30 North Gould Street, Sheridan, WY 82801
+1-415-325-5166
Vietnam
193/26/4 St.no.6, Ward Binh Hung Hoa, Binh Tan District, Ho Chi Minh City
+84-865-399-124
United States (Head Office)
30 North Gould Street, Sheridan, WY 82801
+1-415-325-5166
Australia
63 Fiona Drive, Tamworth, NSW
+61-448-061-727
India
C130 Sector 2 Noida, Uttar Pradesh 201301
+91-723-689-1189
Philippines
40th Floor, PBCom Tower, 6795 Ayala Avenue Cor V.A Rufino St. Makati City, 1226.
+63-287-899-028, +63-967-048-3306
United Kingdom
6 Gardner Place, Becketts Close, Feltham TW14 0BX, Greater London
+44-753-713-2163
Vietnam
193/26/4 St.no.6, Ward Binh Hung Hoa, Binh Tan District, Ho Chi Minh City
+84-865-399-124


Share