

Consumer Insights
Uncover trends and behaviors shaping consumer choices today
Procurement Insights
Optimize your sourcing strategy with key market data
Industry Stats
Stay ahead with the latest trends and market analysis.

The global salmon market was volumed at 4.67 Million Tons in 2025. The market is expected to grow at a CAGR of 3.80% during the forecast period of 2026-2035 to reach a volume of 6.78 Million Tons by 2035. This growth is supported by investments in sustainable technologies like recirculating aquaculture systems (RAS) and eco-friendly feed alternatives. Strategic government initiatives, such as Australia’s goal for aquaculture to account for 64% of seafood production by 2028–29, further drive the market.
Global industry is being driven by rising health consciousness, innovations in aquaculture, and evolving consumer preferences. Since 2013, salmon consumption has grown steadily, with the United States seeing a 7% annual increase and the EU 3%, reflecting strong demand in developed markets. This salmon market trend is supported by the growth of value-added products, online retail, and foodservice channels.
Sustainability initiatives, technological advancements in farming, and supportive government policies are further fueling market growth. Investments in recirculating aquaculture systems (RAS), eco-friendly feeds, and responsible sourcing are helping meet consumer expectations for traceability, shaping the salmon market dynamics. By 2050, global seafood production is expected to reach 160 million metric tons, with seafood accounting for over 30% of protein consumption, particularly in Southeast Asia. As emerging markets like China expand, and established regions maintain growth, salmon’s role in global food security and sustainable protein supply is expected to strengthen in the coming years.
Base Year
Historical Period
Forecast Period
Compound Annual Growth Rate
3.8%
Value in Million Tons
2026-2035
*this image is indicative*
Sustainability is a pivotal factor in the global salmon market dynamics, with producers increasingly adopting advanced technologies and best practices to minimize environmental impact and meet evolving regulatory standards. A 2025 Canadian industry study highlighted notable improvements in key sustainability metrics, including reduced fish escapes, lower antibiotic and pesticide usage, and superior feed conversion ratios. The integration of AI-driven monitoring and semi-closed containment systems is further enhancing operational efficiency and fish health. As regulatory frameworks tighten, such as the planned phase-out of open-net pens in British Columbia, investment in sustainable farming methods is positioning salmon as a leading eco-friendly protein source worldwide.
Significant government funding initiatives are driving the growth of the salmon market by supporting sustainable fisheries and long-term supply stability. Canada’s Pacific Salmon Strategy Initiative (PSSI) is the country’s largest investment in wild salmon conservation, focusing on habitat restoration and hatchery enhancement to combat climate change and population declines. Similarly, the United States Pacific Coastal Salmon Recovery Fund, managed by NOAA Fisheries, has allocated over USD 1.8 billion since 2000 to restore habitats and support salmon populations. Recent funding boosts in 2024–2025 are accelerating climate resilience projects, reinforcing a sustainable and resilient salmon industry across North America and beyond.
Product innovation is a key driving factor in the global salmon market growth, as companies introduce a wide range of value-added and convenience-focused products to meet evolving consumer demands. Ready-to-eat, marinated, smoked, and portion-controlled salmon offerings are becoming increasingly popular, catering to consumers seeking healthy, high-quality meal solutions. In March 2024, Multi X launched new products such as Latitude 45 Smoked Salmon Candy Bites and Smoked Chipotle Salmon in the United States market, aligning with trends toward premiumization and flavor innovation.
Feed innovation is driving sustainability in the salmon sector. In 2022, Scottish trials of hemp seed protein as a plant-based feed ingredient demonstrated significant potential to reduce reliance on imported soy and fishmeal, while promoting a zero-waste supply chain. Concurrently, New Zealand’s Akaroa King Salmon became the world’s first king salmon producer to adopt BioMar’s Blue Impact feed, which includes cultivated algal oil, fish trimmings, and insect meal. This initiative not only reduces the environmental footprint but also supports net-positive fish production, accelerating the salmon market opportunities.
Despite ongoing inflation and rising prices, global consumers are increasingly prioritizing health, wellness, and sustainability in their seafood purchases. According to the Norwegian Seafood Council’s 2025 report, 78% of consumers in China, 71% in Thailand, and 56% in the United Kingdom are willing to pay a premium for sustainable seafood options. Health benefits, transparency, and ethical sourcing are major motivators, with consumers seeking products that align with their values, even in economically challenging times.
Read more about this report - REQUEST FREE SAMPLE COPY IN PDF
The EMR’s report titled “Global Salmon Market Report and Forecast 2026-2035” offers a detailed analysis of the market based on the following segments:
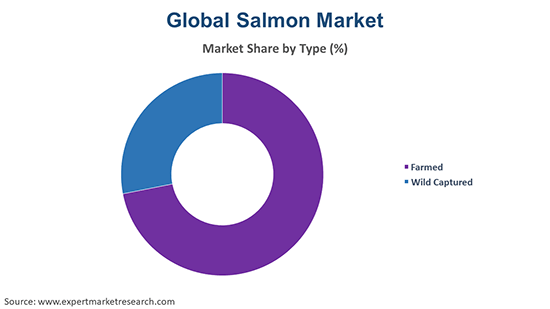
Market Breakup by Type
Key Insight: Farmed salmon holds the largest share in the salmon market, due to its consistent supply, scalability, and ability to meet the growing year-round demand for salmon globally. The farmed category growth is supported by technological advancements and sustainability initiatives in aquaculture. Wild captured salmon, while smaller in share, is gaining traction in premium markets where consumers value natural sourcing and unique flavor profiles.
Market Breakup by Species
Key Insight: Atlantic salmon remains the dominant species, driven by its suitability for aquaculture, rapid growth, and strong consumer demand in key markets. The Atlantic category is supported by ongoing investments in breeding and disease management. Pink salmon, however, is the fastest-growing species, contributing to the salmon market value. Its popularity is largely driven by its use in canned and processed forms, particularly in North America and Russia, where it meets the growing demand for affordable and convenient protein sources, enhancing market accessibility.
Market Breakup by End Product
Key Insight: Frozen salmon dominates the market due to its long shelf life, ease of transport, and suitability for global distribution. Continued advancements in freezing technology and logistics are expanding its reach into new markets, further reinforcing its market leadership. On the other hand, fresh salmon is driven by consumer demand for premium, high-quality seafood in both retail and foodservice channels. The increasing growth of cold chain infrastructure and the rise of direct-to-consumer sales are also contributing to the surge in fresh salmon demand.
Market Breakup by Distribution Channel
Key Insight: Retail is the largest distribution channel for salmon, capturing the majority of sales through widespread availability in supermarkets, hypermarkets, and online platforms. The retail category is set to continue its growth, driven by the expansion of modern grocery formats and the rise of e-commerce. Foodservice, however, is the fastest-growing channel, fueled by the increasing popularity of salmon in restaurants, cafes, and food delivery services, boosting the salmon market opportunities. This growth is particularly strong in urban centers and emerging economies, where dining out and premium menu options are becoming more common.
Market Breakup by Region
Key Insight: Norway remains the largest producer of farmed salmon, accounting for approximately 46% of global production, supported by its established aquaculture infrastructure. Chile is the fastest-growing farmed salmon producer, driven by regulatory improvements and increased technological investments. In wild-captured salmon, the United States leads, primarily through its Alaskan fisheries, maintaining strong production growth. Russia, however, is the fastest-growing wild-captured producer, driven by the expansion of its fisheries and increasing exports. The European Union is the largest consumer, with strong demand, while China is the fastest-growing consumer market, fueled by urbanization and rising health awareness.
Farmed salmon emerges to be both the largest and fastest-growing segment in the global market
Farmed salmon is both the largest and fastest-growing category in the salmon market, driven by its year-round supply, cost efficiency, and ability to meet growing global demand. Technological advancements in aquaculture, such as recirculating aquaculture systems, have improved yields and product quality, further reinforcing its dominance. Additionally, farmed salmon continues to see rapid growth due to expanding consumption in emerging markets and ongoing investments in sustainable aquaculture. Wild-captured salmon faces growth constraints from environmental and regulatory challenges, making farmed salmon the primary growth driver in the industry.
By species, Atlantic salmon dominates the market driven by its high protein and omega-3 content
Atlantic salmon drives maximum demand in the salmon market, with its high protein and omega-3 content, rapid growth rate, and adaptability to large-scale aquaculture, particularly in regions like Norway and Chile. These factors make Atlantic salmon a preferred choice for both producers and consumers, meeting the growing demand for nutritious seafood globally. As consumer demand continues to rise across both developed and emerging markets, the Atlantic salmon category is poised to maintain its dominant position in the market well into the future.
On the other hand, the growth of pink salmon consumption is fueled by its demand as an affordable and convenient protein source, particularly in canned and processed forms in North America and Russia. Its short life cycle and natural abundance allow for rapid production increases, making it an appealing choice for cost-conscious consumers. As the demand for sustainable, value-driven protein continues to rise, pink salmon’s share is set to expand, driven by its affordability and accessibility.
By end product, fresh salmon secures the largest share due to consumer preference for its superior taste, texture, and nutritional benefits
Fresh salmon holds the largest share of the global salmon market revenue, driven by consumer preference for its superior taste, texture, and nutritional benefits. Its appeal is especially strong in developed markets, where health-conscious consumers and culinary trends favor unprocessed, preservative-free seafood. The category benefits from the flexibility it offers in cooking and the premium positioning in both retail and foodservice channels. Supported by robust cold chain infrastructure and rising demand in supermarkets and specialty stores, fresh salmon is expected to maintain its dominance as the preferred choice for high-quality, protein-rich seafood
Frozen salmon is the fastest-growing end use category, fueled by increasing global demand for convenient, long-lasting seafood options, as well as advances in freezing technology that help preserve quality and nutrients. The expansion of cold chain logistics and the rise of e-commerce and international trade have made frozen salmon more accessible to consumers globally. As busy lifestyles and urbanization drive demand for ready-to-cook and easy-to-store protein sources, frozen salmon is set to outpace other product forms in the coming years.
Retail distribution channels occupy a substantial share of the market
Retail is the largest distribution channel boosting salmon demand, driven by the proliferation of supermarkets, hypermarkets, and specialty seafood stores. Consumers appreciate the convenience, accessibility, and variety provided by retail outlets. With the rise of modern grocery formats and e-commerce platforms, the retail channel is poised for steady growth. The growing popularity of online grocery shopping and increasing availability of seafood in both urban and rural regions are further bolstering the retail channel's dominance in the market.
Foodservice is the fastest-growing distribution channel, driven by the increasing popularity of salmon in restaurants, hotels, and catering services, particularly in premium seafood dishes, sushi, and fine dining options. The demand for high-quality seafood in both developed and emerging economies is fueling the expansion of foodservice channels. As consumer preferences shift towards dining out and trying new food experiences, foodservice providers are increasingly incorporating salmon into their menus, further driving the category's growth.


Norway commands the leading position in terms of salmon production
Norway remains the world’s leading producer of farmed salmon, accounting for nearly half of global production due to its ideal fjord environment, advanced aquaculture technology, and robust regulatory framework. In 2025, Norway’s salmon industry is projected to generate over USD 10 billion in revenue, with annual production surpassing 1.5 million tons. Chile ranks as the second-largest farmed salmon producer, benefiting from its extensive coastline and favorable climate, producing over 800,000 tons annually, supported by major industry players like AquaChile and Cermaq. Other significant contributors include Scotland, Canada, and the Faroe Islands. In wild-captured salmon, the United States leads the global market, primarily from Alaska’s abundant fisheries, followed by Russia and Japan.
On the consumption side, the European Union remains the largest salmon market, driven by a strong culinary tradition and proximity to major producers like Norway and Scotland. Key consumers include Germany, France, Italy, and Spain, with Italy absorbing nearly 10% of Norwegian salmon exports. The United States also represents a significant market. In Asia, China and Japan are seeing rapid growth in salmon consumption, fueled by rising incomes, urbanization, and increasing demand for healthy, premium seafood.
The global market is highly competitive, characterized by a mix of multinational aquaculture companies, regional producers, and specialized fisheries. Salmon market players compete based on efficiency, sustainability, product innovation, and global distribution. Strategic initiatives include significant investments in advanced aquaculture technologies such as recirculating aquaculture systems (RAS), offshore farming, and sustainable feed formulations to enhance yield and reduce environmental impact.
Salmon companies are also focusing on value-added products, branding, and traceability programs to align with evolving consumer preferences and regulatory requirements. Ongoing consolidation, strategic alliances, and market expansion further intensify competition and drive continued market growth. Moreover, the integration of digital technologies like IoT-based monitoring, blockchain-enabled supply chains, and AI-driven predictive analytics is transforming operational efficiency, sustainability, and transparency. Growing consumer demand for responsibly farmed seafood, coupled with strict international quality standards, continues to push companies toward innovation and differentiation in a dynamic aquaculture landscape.
Founded in 1995 and headquartered in Oslo, Norway, Cermaq Group AS is a global leader in sustainable salmon farming. Its portfolio includes Atlantic salmon and trout, with strong operations across Norway, Chile, and Canada. The company emphasizes eco-friendly practices, innovation in feed, and disease prevention, holding certifications such as ASC and GlobalG.A.P.
Established in 1899 and headquartered in Bergen, Norway, Lerøy Seafood Group is one of the largest salmon and trout farming companies globally. Its diverse portfolio spans fresh and processed salmon, whitefish, and value-added seafood products. With operations in over 80 markets, Lerøy maintains strong global distribution and is renowned for sustainability and traceability.
Founded in 1964 and headquartered in Bergen, Norway, Mowi ASA is the world’s largest producer of Atlantic salmon. Its product portfolio covers fresh, frozen, smoked, and value-added salmon products. Operating in more than 25 countries, Mowi’s achievements include setting industry benchmarks for sustainable aquaculture and digital innovation.
Established in 1991 and headquartered in Frøya, Norway, SalMar ASA is a pioneering salmon farming company known for offshore and land-based aquaculture innovations. Its portfolio includes fresh, frozen, and processed salmon products. With operations across Norway, Iceland, and international markets, SalMar has achieved significant milestones in production efficiency and sustainability.
*Please note that this is only a partial list; the complete list of key players is available in the full report. Additionally, the list of key players can be customized to better suit your needs.*
Explore the latest trends shaping the salmon market 2026-2035 with our in-depth report. Gain strategic insights, future forecasts, and key market developments that can help you stay competitive. Download a free sample report or contact our team for customized consultation on salmon market trends 2026.


Upto 15% Off
USD
$2499 $2249
$3999 $3599
$4999 $4249
$5999 $5099


*While we strive to always give you current and accurate information, the numbers depicted on the website are indicative and may differ from the actual numbers in the main report. At Expert Market Research, we aim to bring you the latest insights and trends in the market. Using our analyses and forecasts, stakeholders can understand the market dynamics, navigate challenges, and capitalize on opportunities to make data-driven strategic decisions.*
Get in touch with us for a customized solution tailored to your unique requirements and save upto 35%!
In 2025, the salmon market reached an approximate volume of 4.67 Million Tons.
The market is projected to grow at a CAGR of 3.80% between 2026 and 2035.
By 2035, the market is estimated to attain a volume of almost 6.78 Million Tons.
Key strategies driving the market include adopting sustainable aquaculture technologies like recirculating and offshore farming and forming strategic partnerships to strengthen global distribution networks.
The launch of value-added items by producers, like canned salmon, frozen, smoked, and suckling salmon, along with salmon oil, lox, and spreads, is a major trend driving the growth of the salmon market.
The major farmed salmon producing countries are Norway, Chile, Scotland, Canada, and Faroe Islands, among others, whereas the major wild captured salmon producing countries are the United States, Russia, Japan, and Canada, among others.
The European Union, Russia, the United States, Brazil, Japan, and China, among others, are the leading salmon consuming countries globally.
The major types of salmon in the market are farmed and wild captured.
The significant species of salmon considered in the market report include Atlantic, Pink, Chum/Dog, Coho, and Sockeye, among others.
The major end products of salmon include frozen, fresh, and canned, among others.
The several distribution channels in the market are foodservice and retail, among others.
The key players in the market include Cermaq Group AS, Lerøy Seafood Group, and Mowi ASA, SalMar ASA, among others.
The key challenges noted in the salmon market are disease management and parasite control, high operational and feed costs, environmental concerns and regulatory pressures, and meeting rising consumer demand for sustainability while maintaining profitability.
Explore our key highlights of the report and gain a concise overview of key findings, trends, and actionable insights that will empower your strategic decisions.
| REPORT FEATURES | DETAILS |
| Base Year | 2025 |
| Historical Period | 2019-2025 |
| Forecast Period | 2026-2035 |
| Scope of the Report |
Historical and Forecast Trends, Industry Drivers and Constraints, Historical and Forecast Market Analysis by Segment:
|
| Breakup by Type |
|
| Breakup by Species |
|
| Breakup by End Product |
|
| Breakup by Distribution Channel |
|
|
Breakup by Region |
|
| Market Dynamics |
|
| Competitive Landscape |
|
| Companies Covered |
|
| Report Price and Purchase Option | Explore our purchase options that are best suited to your resources and industry needs. |
| Delivery Format | Delivered as an attached PDF and Excel through email, with an option of receiving an editable PPT, according to the purchase option. |
Datasheet
One User
USD 2,499
USD 2,249
tax inclusive*
Single User License
One User
USD 3,999
USD 3,599
tax inclusive*
Five User License
Five User
USD 4,999
USD 4,249
tax inclusive*
Corporate License
Unlimited Users
USD 5,999
USD 5,099
tax inclusive*
*Please note that the prices mentioned below are starting prices for each bundle type. Kindly contact our team for further details.*
Flash Bundle
Small Business Bundle
Growth Bundle
Enterprise Bundle
*Please note that the prices mentioned below are starting prices for each bundle type. Kindly contact our team for further details.*
Flash Bundle
Number of Reports: 3
20%
tax inclusive*
Small Business Bundle
Number of Reports: 5
25%
tax inclusive*
Growth Bundle
Number of Reports: 8
30%
tax inclusive*
Enterprise Bundle
Number of Reports: 10
35%
tax inclusive*
How To Order

Select License Type
Choose the right license for your needs and access rights.

Click on ‘Buy Now’
Add the report to your cart with one click and proceed to register.

Select Mode of Payment
Choose a payment option for a secure checkout. You will be redirected accordingly.
Gain insights to stay ahead and seize opportunities.

Get insights & trends for a competitive edge.

Track prices with detailed trend reports.

Analyse trade data for supply chain insights.

Leverage cost reports for smart savings

Enhance supply chain with partnerships.

Connect For More Information
Our expert team of analysts will offer full support and resolve any queries regarding the report, before and after the purchase.
Our expert team of analysts will offer full support and resolve any queries regarding the report, before and after the purchase.
We employ meticulous research methods, blending advanced analytics and expert insights to deliver accurate, actionable industry intelligence, staying ahead of competitors.
Our skilled analysts offer unparalleled competitive advantage with detailed insights on current and emerging markets, ensuring your strategic edge.
We offer an in-depth yet simplified presentation of industry insights and analysis to meet your specific requirements effectively.


Share