

Consumer Insights
Uncover trends and behaviors shaping consumer choices today
Procurement Insights
Optimize your sourcing strategy with key market data
Industry Stats
Stay ahead with the latest trends and market analysis.

The global rare earth magnet market attained a value of nearly USD 23994.05 Million in 2025. The market is further expected to grow at a CAGR of 9.10% during the forecast period of 2026-2035 to reach a value of USD 57325.92 Million by 2035.
Base Year
Historical Period
Forecast Period
Growing demand for electric vehicles, wind energy, automotive technology, and consumer electronics fuels the rare earth magnet market growth.
According to the U.S. Energy Department, USD 30 million was funded to research labs to secure domestic supply chains for critical materials in September 2021.
By 2040, there is anticipated to be a shortage of 240,000 tonnes of rare earth magnets, boosting focus on recycling and circularity.
Compound Annual Growth Rate
9.1%
Value in USD Million
2026-2035
*this image is indicative*
| Global Rare Earth Magnet Market Report Summary | Description | Value |
| Base Year | USD Million | 2025 |
| Historical Period | USD Million | 2019-2025 |
| Forecast Period | USD Million | 2026-2035 |
| Market Size 2025 | USD Million | 23994.05 |
| Market Size 2035 | USD Million | 57325.92 |
| CAGR 2019-2025 | Percentage | XX% |
| CAGR 2026-2035 | Percentage | 9.10% |
| CAGR 2026-2035 - Market by Region | Asia Pacific | 10.5% |
| CAGR 2026-2035 - Market by Country | India | 12.0% |
| CAGR 2026-2035 - Market by Country | China | 10.3% |
| CAGR 2026-2035 - Market by Magnet Type | NdFeB Magnets | 10.0% |
| CAGR 2026-2035 - Market by Application | Electronics | 10.4% |
| Market Share by Country 2025 | Japan | 4.2% |
Rare earth magnets are permanent magnets made from magnetised materials that produce their magnetic field. These include rare earth alloys such as neodymium, samarium, and dysprosium, among others. Rare earth permanent magnets, unlike electromagnets, do not lose their magnetic properties until they are heated above the Curie temperature.
Read more about this report - REQUEST FREE SAMPLE COPY IN PDF
Being the strongest permanent magnets available, rare earth magnets’ performance is significantly better than ceramic/ferrite magnets and alnico magnets (composed of strontium, carbonate, and iron oxide, and, aluminium, nickel and cobalt, respectively).
Rising demand for electric vehicles, enhanced investment in wind energy, breakthroughs in high-temperature magnet technology, and an emphasis on sustainable production and recycling are propelling the rare earth magnet market expansion.
Increasing demand for rare earth magnets in electric vehicles; growing investments in renewable wind energy; advancements in high-temperature applications; and focus on recycling and sustainable practices are propelling market expansion.
The global shift towards electric mobility fuels the demand for rare earth magnets in EV motors.
Rising investments in renewable energy, particularly wind turbines, amplify the need for high-efficiency rare earth magnets, supporting sustainable energy solutions.
Continuous R&D efforts lead to the development of rare earth magnets capable of operating under extreme temperatures, expanding their application range.
Growing environmental concerns push for the recycling of rare earth magnets and the adoption of sustainable manufacturing practices, reducing reliance on mining.
Major factors expected to drive the market during the forecast period include growth of the automotive sector due to technological advances as well as increased consumer goods demand. Due to the growing consumer spending and the increasing internet penetration across the world, the market is being driven by the rising sales of electronic devices such as smartphones, tablets, televisions, and computers. Thanks to rising customer awareness and government initiatives and schemes, sales of electric and hybrid vehicles are increasing around the world, propelling the rare earth magnet market expansion.
Furthermore, the market is expected to benefit from the substantial expansion of the wind energy generation industry as a result of rapid industrialisation, population growth, and increased demand for electricity. However, the rare earth magnet market can be hampered by price fluctuations in rare earth materials such as dysprosium and neodymium as a result of China's ban on exporting rare earth elements to other regions.
Read more about this report - REQUEST FREE SAMPLE COPY IN PDF
“Global Rare Earth Magnet Market Report and Forecast 2026-2035” offers a detailed analysis of the market based on the following segments:
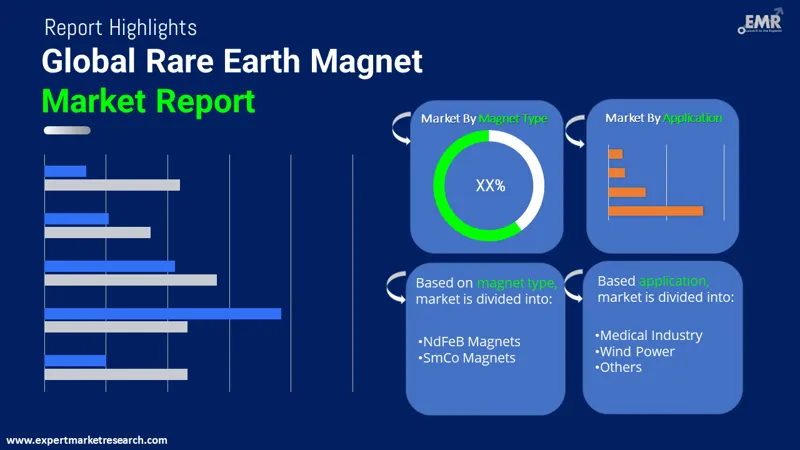
Market Breakup by Magnet Type
Market Breakup by Application
Market Breakup by Region
The various applications of NdFeB magnets include Automobile, Electronics, Power Generators, Medical Industry, and Wind Power, among others, whereas the different applications of SmCo magnets are defence, aerospace, electronics, medical devices, and motors, actuators and industrial application.
NdFeB magnets are expected to dominate the rare earth magnet market share in the forecast period, due to their excellent magnetic properties
NdFeB (Neodymium Iron Boron) magnets are generally considered the leading magnet type. NdFeB magnets are known for their strong magnetic properties and high energy density, making them widely used in various applications, including electronics, automotive, medical devices, and renewable energy.
SmCo (Samarium Cobalt) magnets also possess strong magnetic properties but are typically more expensive than NdFeB magnets. The choice between NdFeB and SmCo magnets often depends on specific application requirements, cost considerations, and temperature stability.
The rare earth magnet market is thriving on account of surging HEV adoption and rising demand for high-performance vehicles
Over the forecast period, the market is expected to benefit from the expanding application spectrum of NdFeB magnets in HEVs and an increase in demand for high-performance vehicles. Magnets play a crucial role in electric motors and powertrains of HEVs, contributing to improved efficiency and overall performance.
Increasing research activities to explore the potential of neodymium magnets for both diagnostic and therapeutic applications are expected to further aid the market growth in the coming years.
Some of the major players in the rare earth magnet market are increasingly investing in the development of innovative manufacturing processes for rare earth magnets.
Proterial Ltd is a cutting-edge materials technology company, specialising in advanced magnetic materials. Its innovative solutions cater to diverse industries, offering high-performance materials for applications ranging from electronics to renewable energy, contributing to technological advancements globally.
Shin-Etsu Chemical Co., Ltd stands as a prominent global chemical company. Renowned for its expertise in manufacturing rare earth magnets, the company plays a crucial role in various industries, including electronics, automotive, and renewable energy, contributing to technological progress and sustainability.
Arnold Magnetic Technologies is a leading manufacturer of high-performance magnets, magnetic assemblies, and precision thin metals. Its innovative solutions cater to diverse applications, including aerospace, medical, and automotive industries, providing cutting-edge magnetic technologies for enhanced performance and efficiency.
Bunting Magnetics Co. is a well-established name in the magnetic equipment industry. Specialising in magnetic separation, metal detection, and material handling solutions, the company serves diverse sectors, including recycling, mining, and manufacturing, contributing to efficient and sustainable material processing worldwide.
*Please note that this is only a partial list; the complete list of key players is available in the full report. Additionally, the list of key players can be customized to better suit your needs.*
Other key players in the global rare earth magnet market are Electron Energy Corporation, and others.
Niron, a startup in Minneapolis, United States, has started testing the production of permanent magnets with iron nitride. The company has received funding of USD 100 million to scale up its project and produce the magnets without using rare-earth materials from China.


The United States market is anticipated to grow rapidly as organisations in the country are actively exploring initiatives to fortify their domestic rare earth supply chain, recognising the critical significance of securing a sustainable and diverse source for these essential elements. This strategic effort aligns with national security imperatives and aims to bolster technological development within the country.
| CAGR 2026-2035 - Market by | Country |
| India | 12.0% |
| China | 10.3% |
| Canada | 8.5% |
| Germany | 7.5% |
| Australia | 7.1% |
| USA | XX% |
| UK | XX% |
| France | XX% |
| Italy | 6.4% |
| Japan | XX% |
| Saudi Arabia | XX% |
| Brazil | XX% |
| Mexico | XX% |
While China currently leads in rare earth production and supply, other regions, including Japan, Europe, and the United States, are actively exploring strategies to diversify sources and secure their rare earth supply chains.


Upto 15% Off
USD
$2499 $2249
$3999 $3599
$4999 $4249
$5999 $5099


*While we strive to always give you current and accurate information, the numbers depicted on the website are indicative and may differ from the actual numbers in the main report. At Expert Market Research, we aim to bring you the latest insights and trends in the market. Using our analyses and forecasts, stakeholders can understand the market dynamics, navigate challenges, and capitalize on opportunities to make data-driven strategic decisions.*
Get in touch with us for a customized solution tailored to your unique requirements and save upto 35%!
In 2025, the global rare earth magnet market attained a value of USD 23994.05 Million.
The market is projected to grow at a CAGR of 9.10% between 2026 and 2035.
The major drivers of the market include growing internet penetration, rising sales of electronic devices, rising customer awareness through government initiatives and schemes, expansion of wind energy generation plants, and rapid industrialisation.
The growth in the automotive industry, fuelled by technological advances, and increased consumer demand are the key market trends.
The major regions in the market are China, Japan, Europe, the United States, and others.
The market is divided, based on magnet type, into NdFeB magnets and SmCo magnets.
In terms of application, NdFeB magnets can be categorised into automobile, electronics, power generators, medical industry, and wind power, among others. Meanwhile, the different applications of SmCo magnets are defence, aerospace, electronics, and medical devices, among others.
The major players in the market are Proterial Ltd, Shin-Etsu Chemical Co., Ltd, Arnold Magnetic Technologies, Bunting Magnetics Co., and Electron Energy Corporation, Others, among others.
The market is estimated to witness a healthy growth in the forecast period of 2026-2035 to reach USD 57325.92 Million by 2035.
Explore our key highlights of the report and gain a concise overview of key findings, trends, and actionable insights that will empower your strategic decisions.
| REPORT FEATURES | DETAILS |
| Base Year | 2025 |
| Historical Period | 2019-2025 |
| Forecast Period | 2026-2035 |
| Scope of the Report |
Historical and Forecast Trends, Industry Drivers and Constraints, Historical and Forecast Market Analysis by Segment:
|
| Breakup by Magnet Type |
|
| Breakup by Application |
|
| Breakup by Region |
|
| Market Dynamics |
|
| Competitive Landscape |
|
| Companies Covered |
|
Datasheet
One User
USD 2,499
USD 2,249
tax inclusive*
Single User License
One User
USD 3,999
USD 3,599
tax inclusive*
Five User License
Five User
USD 4,999
USD 4,249
tax inclusive*
Corporate License
Unlimited Users
USD 5,999
USD 5,099
tax inclusive*
*Please note that the prices mentioned below are starting prices for each bundle type. Kindly contact our team for further details.*
Flash Bundle
Small Business Bundle
Growth Bundle
Enterprise Bundle
*Please note that the prices mentioned below are starting prices for each bundle type. Kindly contact our team for further details.*
Flash Bundle
Number of Reports: 3
20%
tax inclusive*
Small Business Bundle
Number of Reports: 5
25%
tax inclusive*
Growth Bundle
Number of Reports: 8
30%
tax inclusive*
Enterprise Bundle
Number of Reports: 10
35%
tax inclusive*
How To Order

Select License Type
Choose the right license for your needs and access rights.

Click on ‘Buy Now’
Add the report to your cart with one click and proceed to register.

Select Mode of Payment
Choose a payment option for a secure checkout. You will be redirected accordingly.
Gain insights to stay ahead and seize opportunities.

Get insights & trends for a competitive edge.

Track prices with detailed trend reports.

Analyse trade data for supply chain insights.

Leverage cost reports for smart savings

Enhance supply chain with partnerships.

Connect For More Information
Our expert team of analysts will offer full support and resolve any queries regarding the report, before and after the purchase.
Our expert team of analysts will offer full support and resolve any queries regarding the report, before and after the purchase.
We employ meticulous research methods, blending advanced analytics and expert insights to deliver accurate, actionable industry intelligence, staying ahead of competitors.
Our skilled analysts offer unparalleled competitive advantage with detailed insights on current and emerging markets, ensuring your strategic edge.
We offer an in-depth yet simplified presentation of industry insights and analysis to meet your specific requirements effectively.


Share