

Consumer Insights
Uncover trends and behaviors shaping consumer choices today
Procurement Insights
Optimize your sourcing strategy with key market data
Industry Stats
Stay ahead with the latest trends and market analysis.
The postoperative pain therapeutics market size was valued at USD 40.73 Billion in 2024, driven by the increasing incidence of surgical procedures across the 8 major markets. It is expected to grow at a CAGR of 5.79% during the forecast period of 2025-2034, to reach USD 71.51 Billion by 2034.
Base Year
Historical Year
Forecast Year
The market is significantly driven by the growing investments in research and development activities, leading to innovative therapies and enhanced patient outcomes.
The rising innovation and product launches are significantly bolstering market growth by ensuring easy access to effective postoperative pain therapeutics therapies.
Rising awareness associated with the excessive usage of opioids in pain management drugs is a substantial factor responsible for continuous research and development of new non-opioid alternatives for patients, driving market growth.


Value in USD Billion
2025-2034
Postoperative Pain Therapeutics Market Outlook
*this image is indicative*
Postoperative pain therapeutics are used to support pain-relieving, postoperative suffering, alleviating physiologic, and psychological effects associated with acute pain. It aims to boost recovery and facilitate better functioning of a patient. These therapeutics can be oral, topical, or injectable and may include drugs like opioids, NSAIDS, or Cox-2 inhibitors. Postoperative pain management generally varies from patient to patient, depending upon the severity and the right combination of treatments.
Rising Number of Surgeries Driving Market Growth
The market growth is fuelled by the rising number of surgical procedures, leading to a high demand for postoperative therapeutics. Pharmaceutical companies are working on bringing non-opioid alternatives for pain relief to patients while reducing reliance on opioids. For instance, in July 2024, Heron Therapeutics, Inc., a commercial-stage biotechnology company announced that ZYNRELEF (bupivacaine and meloxicam) is included in the proposed 2025 Non-Opioid Policy for Pain Relief under the Medicare hospital Outpatient Prospective Payment System ("OPPS") as a qualifying product effective April 1, 2025. The drug has been recognised as a non-opioid and its effectiveness in pain management has been analysed. It has been included in the non-opioid policy where its use is encouraged for postoperative pain management.
Rising Awareness Against Opioids Harnessing Research Studies
The market is experiencing rising awareness of risks and side effects associated with the use of opioids due to which there is a significant rise in research activities in the market. These research studies are focused on exploring non-opioids and their effectiveness in postoperative pain management in varied medical conditions. They play a vital role in clearance of the new therapeutics. For instance, in July 2024, Concentric Analgesics, Inc., a clinical-stage biopharmaceutical company developing novel, non-opioid pain therapeutics, announced the results of a multicenter, randomized clinical trial evaluating vocacapsaicin. The results of the successful clinical trial highlighted a substantial reduction in pain and opioid use for at least one week after bunionectomy with a single dose of vocacapsaicin.
Postoperative Pain Therapeutics Market Trends
The market is witnessing several trends and developments to improve the current scenario. Some of the notable trends are as follows:
Drug Innovation by Market Players
The market is witnessing the active involvement of market players such as major biotechnology companies in research studies to explore potent drug candidates suitable for post-surgical pain management. The clinical studies are poised to bring new treatment options into the market, bolstering market growth, and simultaneously increasing the availability of appropriate pain relief therapeutics.
For instance, in June 2024, Allay Therapeutics, a clinical-stage biotechnology company pioneering ultra-sustained analgesic products to transform post-surgical pain management and recuperation, announced plans to proceed to a Phase 2b registration trial of its lead investigational product ATX101. It combines a biopolymer with an established and verified intracellular sodium ion channel blocker, bupivacaine, to offer weeks of pain relief after total knee arthroplasty (TKA, or replacement), a routine orthopedic procedure. The clinical trial is poised to be backed by strong foundational clinical data from prior exploratory dose-ranging studies. The Phase 2b registration trial is expected to support a new drug application (NDA) filed with the FDA if the clinical trial is successful.
The market is witnessing an increase in the number of approvals by regulatory authorities such as the FDA, bolstering market development. For instance, in October 2023, a non-opioid combination therapy, Combogesic® IV (known as Maxigesic® IV outside the US), developed by Hyloris Pharmaceuticals was approved by the FDA. It is an intravenous (IV) formulation of acetaminophen and ibuprofen for the treatment of postoperative pain.
Growing Preference for Non-Opioid Alternatives
Opioids have been a leading drug class in postoperative pain treatment, however, the growing concerns regarding the addictive nature of opioids have drawn substantial attention to the development of non-opioid alternatives.
Rising Focus on Non-Pharmacological Therapies
Apart from systemic pharmacological therapies, which commonly include medications like opioids, NSAIDs and/or acetaminophen, IV ketamine, IV lidocaine, steroids, gabapentin, or pregabalin, there has been ample emphasis on developing non-pharmacological therapies as well. Some of the prime examples of pain control include cognitive modalities or mechanical modalities such as transcutaneous electrical nerve stimulation (TENS).
Market Breakup by Drug Class
Market Breakup by Route of Administration
Market Breakup by Distribution Channel
Market Breakup by Region
Market Share by Route of Administration Led by Oral Route
The segmentation by route of administration includes topical, oral, injectable, and others. The oral route of administration is expected to lead the market share due to its convenience, ease of use, and patient preference. Oral therapeutics such as NSAIDs and opioids are commonly prescribed after surgery as they are widely available and can be self-administered. By offering systematic pain relief and being cost-effective, oral medications make a popular choice among healthcare providers and patients. These benefits are the major factors solidifying the preference for oral medications in the market.
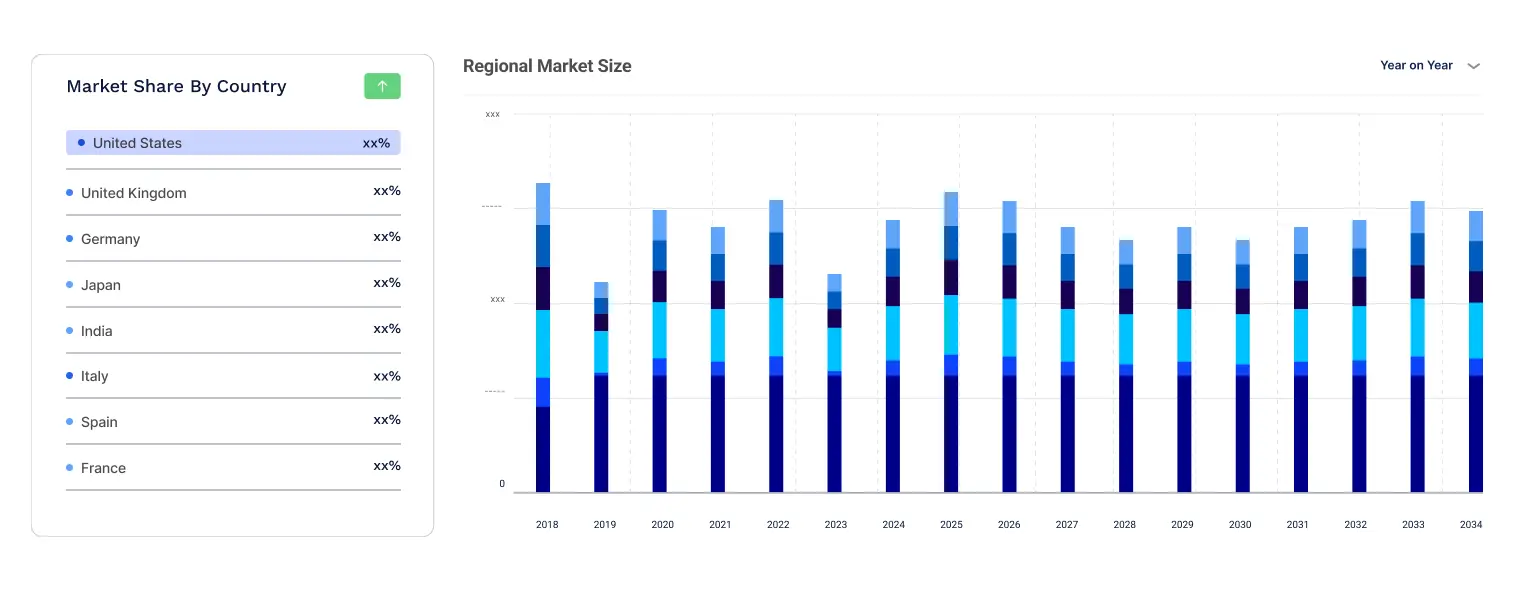
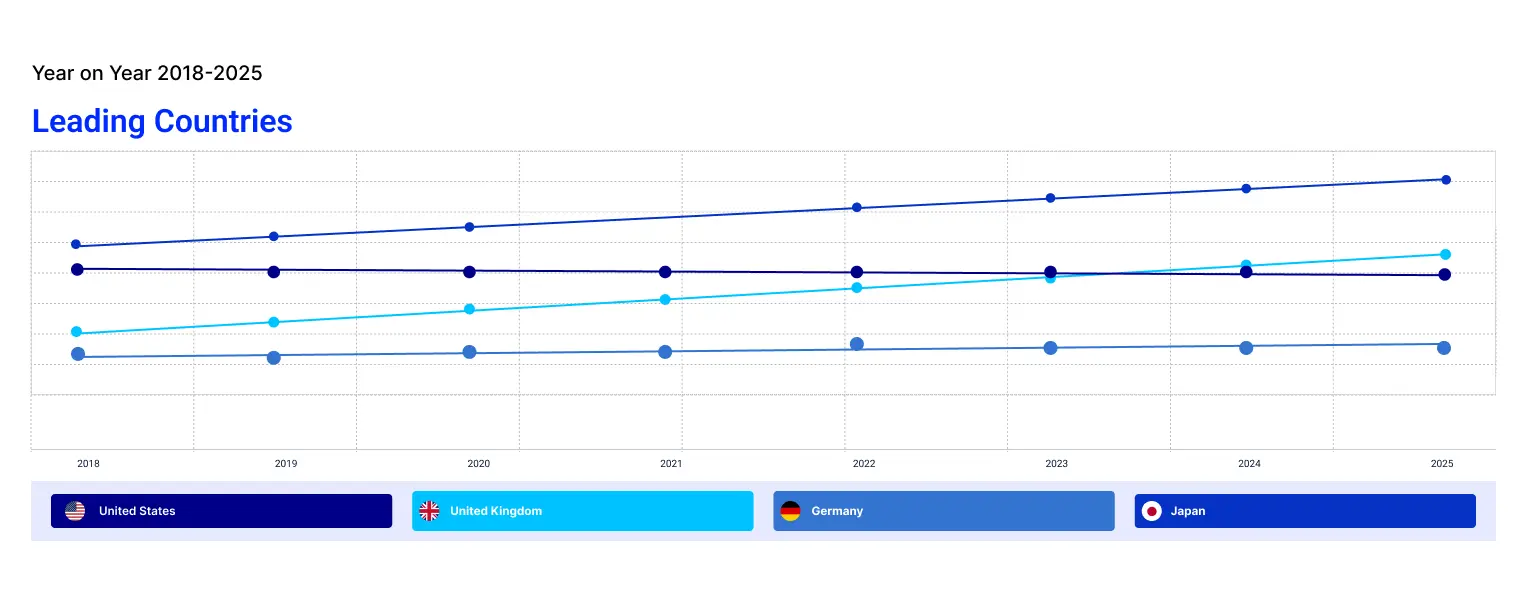
The United States dominates the market share driven by the increasing prevalence of chronic diseases and rising incidence of surgeries, driving the demand for postoperative pain therapeutics in the region. There has been a key focus on offering quality postoperative care to patients with the help of developing several novel techniques. The regional dominance is driven by the technologically advanced healthcare infrastructure and the easy availability of postoperative therapeutics and advanced pharmaceuticals. Additionally, strong support from government health initiatives and the presence of leading pharmaceutical companies in the region, contribute to the dominance. The high healthcare expenditure and well-established reimbursement policies further drive the growth of the market in the United States.
Additionally, EU-4 and the United Kingdom follow closely and account for a significant share of the market. Apart from prominent government healthcare services, the region is witnessing growth due to continuous research and development activities conducted by influential healthcare companies and research institutions present in the region. In addition, the presence of a substantial geriatric population also impacts the market demand.
The key features of the market report comprise patent analysis, clinical trials analysis, grant analysis, funding and investment analysis and strategic initiatives by the leading players. The major companies in the market are as follows:
Founded in 1849 and headquartered in New York City, Pfizer is a leading biopharmaceutical company. It is renowned for its extensive portfolio in the pharmaceutical market, offering treatments for various medical fields, including oncology, vaccines, internal medicine, and rare diseases, with a strong focus on innovative research.
Founded in 1863 and headquartered in Leverkusen, Germany, Bayer is a global pharmaceutical and life sciences company. Its product portfolio includes prescription pharmaceuticals, consumer health products, and crop protection solutions, with a focus on innovations in cardiovascular, oncology, and women's health.
Headquartered in New Jersey, USA, Johnson & Johnson is a multinational pharmaceutical, biotechnology, and medical technologies conglomerate specialising in surgical instruments and technologies.
Established in 1983, and headquartered in San Diego, California, Heron Therapeutics is a global leading biotechnology company specialising in drug development associated with acute care and oncology patients. Its product portfolio includes SUSTOL, CINVANTI, HTX-011 and HTX-034.
*Please note that this is only a partial list; the complete list of key players is available in the full report. Additionally, the list of key players can be customized to better suit your needs.*
Teva Pharmaceuticals USA, Inc.
Established in 1901, and headquartered in Israel, Teva Pharmaceuticals is a global leader in generic medicines and specialty pharmaceuticals, offering a wide portfolio of pain management solutions, including postoperative pain therapeutics. The company focuses on developing and delivering high-quality, affordable treatments to enhance patient care worldwide.
Other key players in the market include Haleon plc (GSK), McKesson Corporation, Pacira Pharmaceuticals, Inc., Cali Biosciences Co., Ltd., and Alembic Pharmaceuticals Ltd.
*While we strive to always give you current and accurate information, the numbers depicted on the website are indicative and may differ from the actual numbers in the main report. At Expert Market Research, we aim to bring you the latest insights and trends in the market. Using our analyses and forecasts, stakeholders can understand the market dynamics, navigate challenges, and capitalize on opportunities to make data-driven strategic decisions.*
Get in touch with us for a customized solution tailored to your unique requirements and save upto 35%!
Explore our key highlights of the report and gain a concise overview of key findings, trends, and actionable insights that will empower your strategic decisions.
| REPORT FEATURES | DETAILS |
| Base Year | 2024 |
| Historical Period | 2018-2024 |
| Forecast Period | 2025-2034 |
| Scope of the Report |
Historical and Forecast Trends, Industry Drivers and Constraints, Historical and Forecast Market Analysis by Segment:
|
| Breakup by Drug Class |
|
| Breakup by Route of Administration |
|
| Breakup by Distribution Channel |
|
| Breakup by Region |
|
| Market Dynamics |
|
| Supplier Landscape |
|
| Companies Covered |
|
Datasheet
One User
USD 3,299
USD 2,969
tax inclusive*
Single User License
One User
USD 5,499
USD 4,949
tax inclusive*
Five User License
Five User
USD 6,999
USD 5,949
tax inclusive*
Corporate License
Unlimited Users
USD 8,199
USD 6,969
tax inclusive*
*Please note that the prices mentioned below are starting prices for each bundle type. Kindly contact our team for further details.*
Flash Bundle
Small Business Bundle
Growth Bundle
Enterprise Bundle
*Please note that the prices mentioned below are starting prices for each bundle type. Kindly contact our team for further details.*
Flash Bundle
Number of Reports: 3
20%
tax inclusive*
Small Business Bundle
Number of Reports: 5
25%
tax inclusive*
Growth Bundle
Number of Reports: 8
30%
tax inclusive*
Enterprise Bundle
Number of Reports: 10
35%
tax inclusive*
How To Order
Our step-by-step guide will help you select, purchase, and access your reports swiftly, ensuring you get the information that drives your decisions, right when you need it.

Select License Type
Choose the right license for your needs and access rights.

Click on ‘Buy Now’
Add the report to your cart with one click and proceed to register.

Select Mode of Payment
Choose a payment option for a secure checkout. You will be redirected accordingly.
Track prices with detailed trend reports.

Analyse trade data for supply chain insights.

Leverage cost reports for smart savings

Enhance supply chain with partnerships.

Gain insights to stay ahead and seize opportunities.

Get insights & trends for a competitive edge.

Track prices with detailed trend reports.
Analyse trade data for supply chain insights.
Leverage cost reports for smart savings
Enhance supply chain with partnerships.
Gain insights to stay ahead and seize opportunities.
Get insights & trends for a competitive edge.
Track prices with detailed trend reports.
Analyse trade data for supply chain insights.
Connect For More Information
Our expert team of analysts will offer full support and resolve any queries regarding the report, before and after the purchase.
Our expert team of analysts will offer full support and resolve any queries regarding the report, before and after the purchase.
We employ meticulous research methods, blending advanced analytics and expert insights to deliver accurate, actionable industry intelligence, staying ahead of competitors.
Our skilled analysts offer unparalleled competitive advantage with detailed insights on current and emerging markets, ensuring your strategic edge.
We offer an in-depth yet simplified presentation of industry insights and analysis to meet your specific requirements effectively.
Australia
63 Fiona Drive, Tamworth, NSW
+61-448-061-727
India
C130 Sector 2 Noida, Uttar Pradesh 201301
+91-723-689-1189
Philippines
40th Floor, PBCom Tower, 6795 Ayala Avenue Cor V.A Rufino St. Makati City,1226.
+63-287-899-028, +63-967-048-3306
United Kingdom
6 Gardner Place, Becketts Close, Feltham TW14 0BX, Greater London
+44-753-713-2163
United States
30 North Gould Street, Sheridan, WY 82801
+1-415-325-5166
Vietnam
193/26/4 St.no.6, Ward Binh Hung Hoa, Binh Tan District, Ho Chi Minh City
+84-865-399-124
United States (Head Office)
30 North Gould Street, Sheridan, WY 82801
+1-415-325-5166
Australia
63 Fiona Drive, Tamworth, NSW
+61-448-061-727
India
C130 Sector 2 Noida, Uttar Pradesh 201301
+91-723-689-1189
Philippines
40th Floor, PBCom Tower, 6795 Ayala Avenue Cor V.A Rufino St. Makati City, 1226.
+63-287-899-028, +63-967-048-3306
United Kingdom
6 Gardner Place, Becketts Close, Feltham TW14 0BX, Greater London
+44-753-713-2163
Vietnam
193/26/4 St.no.6, Ward Binh Hung Hoa, Binh Tan District, Ho Chi Minh City
+84-865-399-124


Share