

Consumer Insights
Uncover trends and behaviors shaping consumer choices today
Procurement Insights
Optimize your sourcing strategy with key market data
Industry Stats
Stay ahead with the latest trends and market analysis.
Trending Now


The global plastic cups market is projected to grow from an estimated value of USD 14.75 Billion in 2024 to USD 32.74 Billion by 2034. In the forecast period of 2025-2034, the market is expected to grow at a CAGR of 8.30%.
Base Year
Historical Year
Forecast Year


Value in USD Billion
2025-2034
Plastic Cups Market Outlook
*this image is indicative*
The growth of the plastic cups market is expected to be driven by regions such as the Asia Pacific, North America, and Europe, which dominate the overall disposable cups market. The market is these regions are expected to be driven by the thriving food and beverage industries. The well-established café culture and the expansion of fast-food chains in North America and Europe are driving the growth of the industry. The rising disposable incomes, increasing living standards, and fast-paced lifestyles are also aiding the growth of the coffee industry in North America, which in turn is aiding the growth of the plastic cups market.
The Asia Pacific is projected to witness a robust growth in the coming years due the rapidly growing beverage industry. The increasing penetration of cafes and restaurants, along with global fast food chains, in tier 1 as well as tier-2 and 3, cities are the major drivers of the plastic cups market growth in the region. China and South Asian countries like India are the major growth drivers of the industry in the Asia Pacific region aided by their economic growth and rising working population.


Plastic cups are manufactured from plastic with the primary intention of acting as containers for beverages, although they can also be used to hold various packaged food products like ready-to-eat noodles, fruits, and dairy products, among others. They can either be single-use cups or could be utilised multiple times.
Market Breakup by Nature:
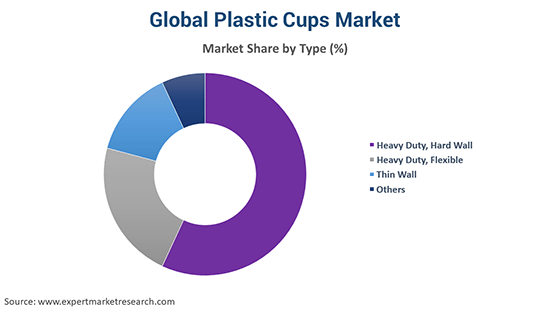
Market Breakup by Type:
Market Breakup by Raw Material:
Market Breakup by Distribution Channel:
Market Breakup by Application:
Read more about this report - REQUEST FREE SAMPLE COPY IN PDF
The global plastic cups market is being driven by the rapid urbanisation and increasing per capita incomes of the consumers across the globe. The global working population has also witnessed an increase, which has led to higher standards of living among consumers, along with increasingly busy lifestyles. This trend has resulted in the growing consumption of processed and packaged foods, which has impacted the plastic cups market positively.
The growing proliferation of coffee houses, restaurants, fast-food chains, and ice-cream parlours across developed and emerging nations have also had a positive impact on the market. The rising consumption of ready-to-drink packaged beverages and packaged dairy products like yoghurts are also acting as catalysts for the market growth. The introduction of attractive designs and packaging shapes are further providing a positive impact on the industry growth. In the coming years, customisable designs and packaging solutions are expected to drive the market growth. The growing R&D activities by the manufacturers and the introduction of heat sensitive labels are expected to be major trends guiding the growth of the plastic cups market. With governments across the globe incentivizing recycling to reduce the carbon footprint, manufacturers are also looking to produce plastic cups out of recyclable materials and encouraging the recycling of their existing cups.
However, the growth of the industry is expected to be constrained by factors such as a complete ban on plastic across various countries and a shift away from non-recyclable materials. In the short term, the industry is also likely to be impacted adversely by the global lockdown due to the COVID-19 pandemic, which has led to restrictions on large gatherings and temporary closures of cafes and restaurants.
The report analyses the following key players in the global plastic cups market, covering their capacities, market share, and latest developments like capacity expansions, plant turnarounds, and mergers, acquisitions, and investments:
The report by EMR assesses the market dynamics of the industry by looking into the key demand and price indicators, along with analysing the market based on SWOT and Porter’s Five Forces models.
Saudi Arabia Structural Steel Market
Europe Freeze-Dried Fruit Products Market
Saudi Arabia Electric Motors and Transformers Maintenance Market
Latin America Flexible Packaging Market
*While we strive to always give you current and accurate information, the numbers depicted on the website are indicative and may differ from the actual numbers in the main report. At Expert Market Research, we aim to bring you the latest insights and trends in the market. Using our analyses and forecasts, stakeholders can understand the market dynamics, navigate challenges, and capitalize on opportunities to make data-driven strategic decisions.*
Get in touch with us for a customized solution tailored to your unique requirements and save upto 35%!
The global plastic cups market is projected to grow from an estimated value of USD 14.75 Billion in 2024.
In the forecast period of 2025-2034, the market is expected to grow at a CAGR of 8.30%.
By 2034, the market is estimated reach a value of USD 32.74 Billion.
The rising disposable incomes, the expansion of quick service restaurants (QSRs) and cafes, and the growing consumption of processed and convenient food and beverage products are driving the market growth.
The key trends guiding the market include the introduction of recyclable cups, the growing popularity of heat sensitive labels, increasing working population, and innovations in designs of plastic cups.
The major regions in the market are North America, the Asia Pacific, Latin America, Europe, and the Middle East and Africa.
Disposable, non disposable, and recyclable are the various segments based on the nature of plastic cups.
The leading types of plastic cups are heavy duty, hard wall, heavy duty, flexible, and thin wall, among others.
Polylactic Acid (PLA), polypropylene (PP), polystyrene (PS), polyethylene terephthalate (PET), and poly vinyl chloride (PVC), among others, are the significant raw materials of plastic cups in the market.
The major applications of plastic cups include chilled food and beverages and hot food and beverages, among others.
The major end-use segments in the market are ice cream industry, QSR and other fast food shops, offices and educational institutions, and residential use, among others.
The various distribution channels in the market are institutional and retail.
The key players in the market are Huhtamäki Oyj, Georgia-Pacific Consumer Products LP., Dart Container Corporation, Greiner Packaging International GmbH, Berry Global Inc., Cosmoplast Ind. Co. (L.L.C.), and Day Young Enterprise Co., Ltd., among others.
Explore our key highlights of the report and gain a concise overview of key findings, trends, and actionable insights that will empower your strategic decisions.
| REPORT FEATURES | DETAILS |
| Base Year | 2024 |
| Historical Period | 2018-2024 |
| Forecast Period | 2025-2034 |
| Scope of the Report |
Historical and Forecast Trends, Industry Drivers and Constraints, Historical and Forecast Market Analysis by Segment:
|
| Breakup by Nature |
|
| Breakup by Type |
|
| Breakup by Raw Material |
|
| Breakup by Distribution Channel |
|
| Breakup by Application |
|
| Breakup by End Use |
|
| Breakup by Region |
|
| Market Dynamics |
|
| Competitive Landscape |
|
| Companies Covered |
|
| Report Price and Purchase Option | Explore our purchase options that are best suited to your resources and industry needs. |
| Delivery Format | Delivered as an attached PDF and Excel through email, with an option of receiving an editable PPT, according to the purchase option. |
Datasheet
One User
USD 2,499
USD 2,249
tax inclusive*
Single User License
One User
USD 3,999
USD 3,599
tax inclusive*
Five User License
Five User
USD 4,999
USD 4,249
tax inclusive*
Corporate License
Unlimited Users
USD 5,999
USD 5,099
tax inclusive*
*Please note that the prices mentioned below are starting prices for each bundle type. Kindly contact our team for further details.*
Flash Bundle
Small Business Bundle
Growth Bundle
Enterprise Bundle
*Please note that the prices mentioned below are starting prices for each bundle type. Kindly contact our team for further details.*
Flash Bundle
Number of Reports: 3
20%
tax inclusive*
Small Business Bundle
Number of Reports: 5
25%
tax inclusive*
Growth Bundle
Number of Reports: 8
30%
tax inclusive*
Enterprise Bundle
Number of Reports: 10
35%
tax inclusive*
How To Order
Our step-by-step guide will help you select, purchase, and access your reports swiftly, ensuring you get the information that drives your decisions, right when you need it.

Select License Type
Choose the right license for your needs and access rights.

Click on ‘Buy Now’
Add the report to your cart with one click and proceed to register.

Select Mode of Payment
Choose a payment option for a secure checkout. You will be redirected accordingly.
Track prices with detailed trend reports.

Analyse trade data for supply chain insights.

Leverage cost reports for smart savings

Enhance supply chain with partnerships.

Gain insights to stay ahead and seize opportunities.

Get insights & trends for a competitive edge.

Track prices with detailed trend reports.
Analyse trade data for supply chain insights.
Leverage cost reports for smart savings
Enhance supply chain with partnerships.
Gain insights to stay ahead and seize opportunities.
Get insights & trends for a competitive edge.
Track prices with detailed trend reports.
Analyse trade data for supply chain insights.
Connect For More Information
Our expert team of analysts will offer full support and resolve any queries regarding the report, before and after the purchase.
Our expert team of analysts will offer full support and resolve any queries regarding the report, before and after the purchase.
We employ meticulous research methods, blending advanced analytics and expert insights to deliver accurate, actionable industry intelligence, staying ahead of competitors.
Our skilled analysts offer unparalleled competitive advantage with detailed insights on current and emerging markets, ensuring your strategic edge.
We offer an in-depth yet simplified presentation of industry insights and analysis to meet your specific requirements effectively.
Australia
63 Fiona Drive, Tamworth, NSW
+61-448-061-727
India
C130 Sector 2 Noida, Uttar Pradesh 201301
+91-723-689-1189
Philippines
40th Floor, PBCom Tower, 6795 Ayala Avenue Cor V.A Rufino St. Makati City,1226.
+63-287-899-028, +63-967-048-3306
United Kingdom
6 Gardner Place, Becketts Close, Feltham TW14 0BX, Greater London
+44-753-713-2163
United States
30 North Gould Street, Sheridan, WY 82801
+1-415-325-5166
Vietnam
193/26/4 St.no.6, Ward Binh Hung Hoa, Binh Tan District, Ho Chi Minh City
+84-865-399-124
United States (Head Office)
30 North Gould Street, Sheridan, WY 82801
+1-415-325-5166
Australia
63 Fiona Drive, Tamworth, NSW
+61-448-061-727
India
C130 Sector 2 Noida, Uttar Pradesh 201301
+91-723-689-1189
Philippines
40th Floor, PBCom Tower, 6795 Ayala Avenue Cor V.A Rufino St. Makati City, 1226.
+63-287-899-028, +63-967-048-3306
United Kingdom
6 Gardner Place, Becketts Close, Feltham TW14 0BX, Greater London
+44-753-713-2163
Vietnam
193/26/4 St.no.6, Ward Binh Hung Hoa, Binh Tan District, Ho Chi Minh City
+84-865-399-124


Share