

Consumer Insights
Uncover trends and behaviors shaping consumer choices today
Procurement Insights
Optimize your sourcing strategy with key market data
Industry Stats
Stay ahead with the latest trends and market analysis.
Trending Now


The global phenol market size reached a value of approximately USD 22.00 Billion in 2024. The industry is expected to grow at a CAGR of 4.20% during the forecast period of 2025-2034. A major driver for the phenol market is the increased demand for bisphenol A (BPA), which is widely used in the production of polycarbonate plastics and epoxy resins. These are necessary for the automotive, construction, and electronics industries, thus aiding the market growth to attain a valuation of USD 33.20 Billion by 2034. Moreover, phenolic resins, which are produced from phenol, play a critical role in various automotive and construction applications. Surging demand for BPA and phenolic resins is driving the growth of the market. In addition, with demand for sustainable products increasing, it is expected to shape the phenol market during the forecast period.
Base Year
Historical Year
Forecast Year
The increasing usage of polycarbonate plastics in the automotive and electronics industries is primarily due to their lightweight, durability, and versatility, thus driving the demand for phenol. B2B companies selling phenol enjoy consistent growth in these sectors, particularly in applications related to vehicle components, consumer electronics, and construction materials, thus augmenting growth in the phenol market.
The demand for epoxy resins in coatings, adhesives, and electrical laminates is increasing, fueling the rise in phenol consumption. In this regard, B2B suppliers of various products, which include construction and aerospace industries, benefit from widespread use of epoxy-based products in high-performance coatings and structural applications.
Phenol is increasingly used in pharmaceutical intermediates and medical products, such as antiseptics and anesthetics. This bodes well for B2B suppliers since the growth of the healthcare industry, driven by the aging population and the increasing number of medical infrastructures, leads to steady demand for phenol-based products.


Value in USD Billion
2025-2034
Phenol Market Outlook
*this image is indicative*
Read more about this report - REQUEST FREE SAMPLE COPY IN PDF
The phenol market is driven by demand in plastics, pharmaceuticals, bio-based innovations, and Asia-Pacific’s industrial growth, supported by applications in automotive, electronics, and sustainability-focused industries.
Phenol is an essential feedstock for bisphenol-A (BPA), which is further used to manufacture polycarbonate plastics and epoxy resins. These are extensively used in various sectors, including automotive, construction, and electronics. For example, polycarbonate plastics are used in car headlight covers, smartphones, optical lenses, and medical devices because of their lightweight, tough, and shatter-resistant characteristics. Epoxy resins are used for coatings and adhesives. The demand in energy-efficient vehicles, electronics, and smart infrastructures is causing the demand in phenol to increase. Currently, companies are increasing their manufacturing capacities, Covestro and SABIC being an example, thus augmenting the phenol demand growth.
Phenol is an intermediate in the drug industry, majorly in producing salicylic acid, used as a starting material for making aspirin. Its antiseptic and disinfectant properties make it useful in medical products such as throat sprays, lozenges, and topical ointments. For instance, phenol is used in products like Chloraseptic for sore throat relief. The increasing interest in healthcare and personal hygiene after COVID-19 has amplified the demand for such products. Furthermore, phenol-based compounds are used in dermatological treatments, such as acne medication. Pharmaceutical majors such as Bayer utilize derivatives of phenol in manufacturing medical products, allowing for continued increase in this domain.
Focus on sustainability with a reduced carbon footprint is nudging the preference toward bio-based phenol. Companies are moving toward renewable sources of raw material, such as lignin by-product from paper industries, that replace petroleum-derived phenol. For instance, firms such as Anellotech and UPChem are developing technologies for the production of bio-phenol from biomass. This shift fits into more stringent environmental regulations and the global emphasis on green chemistry. Bio-based phenol is finding acceptance in applications such as adhesives, coatings, and insulation materials, since industries seek greener products in response to consumers' demands and regulatory requirements, thereby improving the phenol market revenue.
The Asia-Pacific region is the leader in the phenol market, driven by a rapidly flourishing manufacturing sector and rapid urbanization. China, India, and South Korea are leading drivers for this, with vigorous demand coming from various sectors such as electronics and automotive for phenol. As an instance, China uses polycarbonate plastics extensively in electronics, and India's automotive coatings create a great demand, thereby influencing the growth of this market. Moreover, enormous investments are happening in phenol production facilities in this region. For example, LG Chem increased its production capacity in South Korea to meet demand there. Rapid industrial growth in the region further cements its status as a leader in the market for phenol.
Phenol’s most important application is in the manufacturing of phenolic resins, whose demand in several industries is fueling the market. Phenolic resins, used for their strength and heat resistance, find applications in the automotive and construction sectors for parts like brake pads and insulation materials. Industries such as electronics and aerospace are increasingly investing in phenol and its resins for lightweight, durable components. With the increasing demand for these industries, it is projected that there will be a rising demand for phenol, encouraging market growth and innovative products to be launched over the next few years.
The phenol market is a flourishing market with the rising demand of phenolic resins in many of the major industries. Phenolic resins are made from phenol and used in a wide range of applications which include automotive, construction as well as electronics and electrical industries. Phenolic resins are a raw material in the automotive sector and are used for production of brake linings, clutch facings, or other applications which require heat resistance and durability. Likewise, in construction, phenolic resins are utilized for laminates, coatings, and adhesives that provide flame retardancy, electrical insulators, and structural strength. Additionally, the demand for high-performance materials in electronic devices and aerospace applications is expected to increase due to their properties wearing extreme conditions, which is driving the demand for phenolic resins. The global phenol market is also impacted by sustainability, and the companies are striving to produce bio-based phenol in order to reduce reliance on fossil fuels. Growth and development of the market is expected to be driven by growing demand for phenolic resins in automotive, construction, and electrical applications. According to the United Nations COMTRADE international trade database, the United States imported Phenols and Phenol-alcohols from India in 2024 for USD 38.19 million.
Read more about this report - REQUEST FREE SAMPLE COPY IN PDF
Emerging markets like in the Asia-Pacific region, especially in India and China, rapid industrialization and urbanization is leading to high demand for phenol. Phenol is used as a base material in the production of phenolic resins and used in increasing volumes in automotive and construction applications due to its versatility. For the automotive industry, phenolic resins are vital for components such as brake linings and clutch facings that require heat resistance and durability. In construction, they are used in strong impact-resistant coatings and glues. In addition, phenol is an important ingredient in creating polycarbonate plastics, prized for their transparency, lightweight, and strength, that are perfect for eyeglass lenses, optical discs, and electronic components. Persistent demand for polycarbonate plastics in electronics manufacturing and the medical devices sector will also continue to drive market growth with phenolic resins and phenol the most preferred feedstock in this pattern of growth, especially within booming industrial landscape of Asia-pacific.
The phenol market is growing significantly due to the increasing infrastructure development and construction activities in emerging markets such as Asia-Pacific, Latin America, and Middle East and Africa. Demand for phenol production is increasing due to its application in polycarbonate plastics and epoxy resins, essential for consumer electronics market and other applications. The high requirement of these hydrocarbons in crucial end-use verticals across the region is quickly driving the phenol market revenue.
Phenol Application Insights
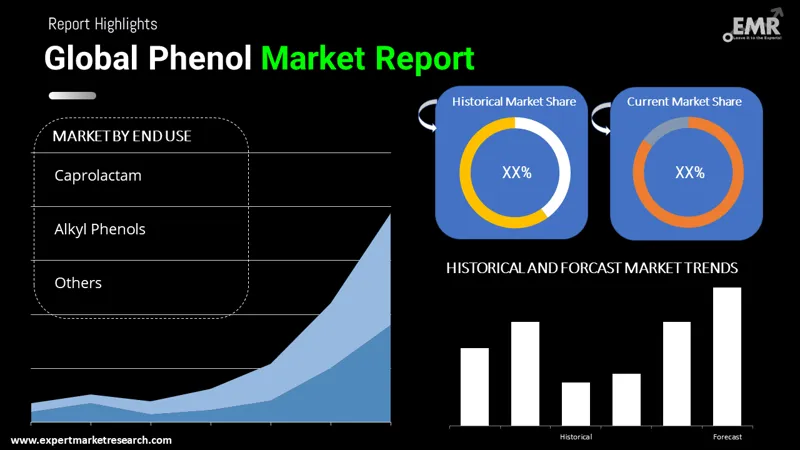
The phenol market can be segmented into application segments such as Bisphenol A (BPA), phenolic resins, caprolactam and alkyl phenyl among others. Bisphenol A is the biggest application of this material, driven by its production in polycarbonate plastics and epoxy resins, a component needed across industries, from automotive to construction and electronics. The phenol market is witnessing expanding growth due to the diversity of BPA application in the manufacturing of strength, stable and high-performance materials.
Another area of importance for phenol is its use in phenolic resins, strong, heat-resistant, durable polymers. They are primarily used for automotive parts, building materials and electrical products. The other significant use of phenol is caprolactam, which is predominantly used for nylon; this is of particular importance to the textile and automotive sectors. alkyl phenyl, a product of phenol, are significant chemicals utilized to produce detergents, lubricants and other industrial products. As demand for these uses increases, the market for phenol has been expanding, and advances in technology have created more demand for high-performance materials across industries.
Read more about this report - REQUEST FREE SAMPLE COPY IN PDF
Phenol End User Insights
Phenol products are used in various end-user industries. It is a crucial raw material in the chemical industry, and it is used as a raw material in the manufacture of high-performance chemicals like bisphenol-A (BPA), phenolic resins, and caprolactam. Phenol finds extensive application in the construction industry to manufacture phenolic resins that are used for heat-resistant long-lasting laminates, adhesives, and coatings, over structural materials.
In the automotive sector, phenol-based chemicals are instrumental to manufacture components like brake linings and clutch facings wherein strength and thermal resistance are of prime importance. The electronic communications sector is another important end user of phenolic resins, for which phenolic resins are instrumental to manufacture electronic components as they offer insulation and mechanical sturdiness for devices. Additionally, the metallurgy industry uses phenol in the production of various chemicals and materials that are essential in the absorption of metals. Phenol and its derivatives have been sustaining their demand from such end-user sectors that are growing consistently with the global industrialization trend leading to the market's expansion across different regions.


North America Phenol Market Trends
The North American region is a significant contributor to the phenol market due to demand from end-use industries such as automotive, construction, and electronics. The U.S. was a major producer and consumer of phenol and was a driver of much of the production and consumption of polycarbonate plastics, epoxy resins and phenolics. Technological advancements in production processes, along with a stronger emphasis on sustainable solutions, are influencing market dynamics. Additionally, strong government regulations supporting green chemistry and bio-based products are allowing eco-friendly chemical substitutes for phenol to take place in the United States, Canada, and Mexico, resulting in further opportunities for the phenol market in these countries.
United States Phenol Market Trends
The growing demand for phenol in industries like automotive, construction, and electronics is further affirming the United States position in the global phenol market. However, the country also seeks more phenol derivatives, given its growing demand for high-end polymers such as polycarbonate plastics and epoxy resins. Furthermore, because of the increasing demand for efficient production, several advanced technologies are being pioneered in production strategies. Regulatory frameworks and the ever-stronger push for sustainability trends leading to the increased production of bio-based phenol play a dynamic role in shaping the phenol market in the United States.
Europe Phenol Market Trends
The phenolic resins segment is crucial in manufacturing processing industries such as automotive, construction, and others; hence, these factors are responsible for this demand in Europe. More emphasis is being placed on sustainable solutions and environmental regulations are anticipated to drive the acceptance of bio-based phenol and other alternatives. Advancing technology in products for example advanced plastics, coatings, in addition to the existing European chemical industry, drive the market. In the key end-user industries of electrical and electronic sectors, the growing demand for phenolic resin also drives the growth of the regional market.
Asia Pacific Phenol Market Trends
The Asia Pacific region is projected to witness the fastest growth rate in the global market share, owing to fast-paced industrialization and urbanization. The industries that majorly use phenolic resins and phenol-based products like automotive, construction, and electronics are growing at a significant rate. The engines of growth are China and India, as both countries focus on manufacturing and infrastructure. Moreover, the emerging consumer electronics industry in the region is supporting the demand for polycarbonate plastics, which consequently driving the consumption of phenol.
Latin America Market Trends
The Latin America phenol market is growing, with steady demand from automotive and construction industries. Some of the driving factors such as fast-paced urbanization and rising infrastructure growth are anticipated to boost the demand for high-performance materials including phenolic resins across various end applications including adhesives & coatings. With this growing trend of industrialization, a growing market in countries such as Brazil and Mexico are expected to dominate the local landscape. In addition, growing investments in the chemical industry are expected to drive the phenol market in the region.
Middle East and Africa Market Trends
The growth of the phenol market in the Middle East and Africa is at slow pace because of the increased infrastructure and industrialization. High demand in construction, automotive and electronics and an increase in manufacturing capabilities in the region are projected to drive the market in the region. In addition, the growing focus on sustainable products and technologies boosts the manufacturing of bio-based phenol. Another key segment that could drive demand for phenol over the coming years is chemical production facilities.
The global phenol market is competitive and quite fragmented. Dominant players are planning mergers or acquisitions to expand their market share, while others are looking for joint ventures and new technologies to boost sustainable production. Leading companies are capitalizing on their robust production networks and brand establishment to meet the rising need for phenol from all the end-use sectors such automotive, construction, electronics and chemicals.
INEOS Group is a global leader in chemical production including phenol and phenol derivatives. INEOS products come with an unmatched track record of quality, and an unrelenting focus on innovation, becoming established as critical components in many applications such as automotive, construction and electronics.
Mitsui Chemicals Inc. specializes in producing specialty chemicals, such as phenolic resins, as well as polycarbonate plastics that the automotive, electronics, and construction industries rely on. Mitsui Chemicals emphasizes sustainability and technological innovation in its production processes.
Shell Chemical Co. is a leading global manufacturer of phenol, which it uses primarily to produce plastics, resins and chemicals. Based on a long-standing global network of suppliers, Shell creates specialty phenol products for various uses, such as in the automobile, construction and electronics industries, all as part of the company's promise to sustainable manufacturing processes.
Solvay SA is a producer of advanced materials like phenolic resins and polycarbonate plastics, and caters to industries like automotive, electronics and construction. The vertically integrated manufacturing process applies the sustainable practices of the company with priority on environmentally friendly production and clever solutions to market requirements.
Honeywell International Inc. provides innovative solutions in the automotive, construction and electronics markets. The company produces phenol products that are used in polycarbonate plastics and epoxy resins. Honeywell is well positioned for growth in the global market, with a focus on energy efficiency and sustainability.
*Please note that this is only a partial list; the complete list of key players is available in the full report. Additionally, the list of key players can be customized to better suit your needs.*
April 2025
INEOS Energy completed the acquisition of the US Gulf business from CNOOC Energy Holdings U.S.A. Inc., a US subsidiary of CNOOC International Limited. The agreement expands INEOS Energy's global production to more than 90 thousand barrels of oil equivalent per day.
April 2025
Shell Singapore Pte Ltd (SSPL), a subsidiary of Shell plc, finalized the previously announced sale of its Energy and Chemicals Park in Singapore to CAPGC Pte. Ltd. (CAPGC), a joint venture of Chandra Asri Capital Pte. Ltd. and Glencore Asian Holdings Pte. Ltd.
February 2025
Amphenol Corporation announced the completion of its acquisition of CommScope's Outdoor Wireless Networks (OWN) and Distributed Antenna Systems (DAS) businesses.
January 2025
Mitsui Chemicals and Mitsubishi Chemical Corporation stated that they are conducting a cooperative study on the steady supply of phenol-related goods.
November 2024
Haldia Petrochemicals Ltd. (HPL), a player in the petrochemical industry, announced a significant milestone in its expansion efforts. The company has entered into a license amendment deal with Lummus Technology to boost phenol production capacity at the planned Phenol and Acetone Plant in Haldia, West Bengal.
January 2024
Amphenol Corporation, one of the world's top providers of high-tech connector, antenna, and sensor solutions, acquired TPC Wire and Cable, a leading developer of ruggedized electrical cabling solutions for tough industrial applications.
April 2023
Solvay, a global scientific and materials firm with solutions that help many parts of daily life, announced a strategic partnership with Ginkgo Bioworks, which is developing the leading platform for cell programming and biosecurity.
June 2022
INEOS Phenol announced a new reduced carbon bioproduct line dubbed INVIRIDISTM for its phenol, acetone, and alphamethylstyrene businesses.
“Phenol Market Report and Forecast 2025-2034” offers a detailed analysis of the market based on the following segments:
Market Breakup by Application
Market Breakup by End User
Market Breakup by Region
*While we strive to always give you current and accurate information, the numbers depicted on the website are indicative and may differ from the actual numbers in the main report. At Expert Market Research, we aim to bring you the latest insights and trends in the market. Using our analyses and forecasts, stakeholders can understand the market dynamics, navigate challenges, and capitalize on opportunities to make data-driven strategic decisions.*
Get in touch with us for a customized solution tailored to your unique requirements and save upto 35%!
In 2024, the market size of phenol was approximately USD 22.00 Billion.
The phenol market is assessed to grow at a CAGR of 4.20% between 2025 and 2034.
The market is estimated to witness healthy growth in the forecast period of 2025-2034 to reach a value of around USD 33.20 Billion by 2034.
The major drivers of the industry such as rising urbanisation, increasing disposable incomes, strong demand from emerging economies, technological advancements, and growing demand for alkyl phenyl are expected to aid the market growth.
Improvements in the phenol production technology, focussed on enhancing output, lowering process costs and improving safety, is expected to be a major trend informing the industry growth.
The major regions in the industry are North America, the Asia Pacific, Europe, Latin America, and the Middle East and Africa, with the Asia Pacific accounting for the largest market share of 52.5%.
The leading end use segment in the industry is bisphenol A, accounting for 47% of market share.
The major players in the industry are INEOS Group, Mitsui Chemicals, Inc., Shell Chemical Co., Solvay SA, Honeywell International Inc., Royal Dutch Shell, Deepak Nitrite Limited, ALTIVIA Chemicals, Sasol Chemicals, Mitsubishi Corporation, and Domo Chemicals, among others.
The Asia Pacific region held the largest market share in 2024.
Bisphenol A accounted for the biggest share in the market as an application.
The construction segment held the largest market share in 2024.
Explore our key highlights of the report and gain a concise overview of key findings, trends, and actionable insights that will empower your strategic decisions.
| REPORT FEATURES | DETAILS |
| Base Year | 2024 |
| Historical Period | 2018-2024 |
| Forecast Period | 2025-2034 |
| Scope of the Report |
Historical and Forecast Trends, Industry Drivers and Constraints, Historical and Forecast Market Analysis by Segment:
|
| Breakup by Application |
|
| Breakup by End User |
|
| Breakup by Region |
|
| Market Dynamics |
|
| Competitive Landscape |
|
| Companies Covered |
|
| Report Price and Purchase Option | Explore our purchase options that are best suited to your resources and industry needs. |
| Delivery Format | Delivered as an attached PDF and Excel through email, with an option of receiving an editable PPT, according to the purchase option. |
Datasheet
One User
USD 2,499
USD 2,249
tax inclusive*
Single User License
One User
USD 3,999
USD 3,599
tax inclusive*
Five User License
Five User
USD 4,999
USD 4,249
tax inclusive*
Corporate License
Unlimited Users
USD 5,999
USD 5,099
tax inclusive*
*Please note that the prices mentioned below are starting prices for each bundle type. Kindly contact our team for further details.*
Flash Bundle
Small Business Bundle
Growth Bundle
Enterprise Bundle
*Please note that the prices mentioned below are starting prices for each bundle type. Kindly contact our team for further details.*
Flash Bundle
Number of Reports: 3
20%
tax inclusive*
Small Business Bundle
Number of Reports: 5
25%
tax inclusive*
Growth Bundle
Number of Reports: 8
30%
tax inclusive*
Enterprise Bundle
Number of Reports: 10
35%
tax inclusive*
How To Order
Our step-by-step guide will help you select, purchase, and access your reports swiftly, ensuring you get the information that drives your decisions, right when you need it.

Select License Type
Choose the right license for your needs and access rights.

Click on ‘Buy Now’
Add the report to your cart with one click and proceed to register.

Select Mode of Payment
Choose a payment option for a secure checkout. You will be redirected accordingly.
Track prices with detailed trend reports.

Analyse trade data for supply chain insights.

Leverage cost reports for smart savings

Enhance supply chain with partnerships.

Gain insights to stay ahead and seize opportunities.

Get insights & trends for a competitive edge.

Track prices with detailed trend reports.
Analyse trade data for supply chain insights.
Leverage cost reports for smart savings
Enhance supply chain with partnerships.
Gain insights to stay ahead and seize opportunities.
Get insights & trends for a competitive edge.
Track prices with detailed trend reports.
Analyse trade data for supply chain insights.
Connect For More Information
Our expert team of analysts will offer full support and resolve any queries regarding the report, before and after the purchase.
Our expert team of analysts will offer full support and resolve any queries regarding the report, before and after the purchase.
We employ meticulous research methods, blending advanced analytics and expert insights to deliver accurate, actionable industry intelligence, staying ahead of competitors.
Our skilled analysts offer unparalleled competitive advantage with detailed insights on current and emerging markets, ensuring your strategic edge.
We offer an in-depth yet simplified presentation of industry insights and analysis to meet your specific requirements effectively.
Australia
63 Fiona Drive, Tamworth, NSW
+61-448-061-727
India
C130 Sector 2 Noida, Uttar Pradesh 201301
+91-723-689-1189
Philippines
40th Floor, PBCom Tower, 6795 Ayala Avenue Cor V.A Rufino St. Makati City,1226.
+63-287-899-028, +63-967-048-3306
United Kingdom
6 Gardner Place, Becketts Close, Feltham TW14 0BX, Greater London
+44-753-713-2163
United States
30 North Gould Street, Sheridan, WY 82801
+1-415-325-5166
Vietnam
193/26/4 St.no.6, Ward Binh Hung Hoa, Binh Tan District, Ho Chi Minh City
+84-865-399-124
United States (Head Office)
30 North Gould Street, Sheridan, WY 82801
+1-415-325-5166
Australia
63 Fiona Drive, Tamworth, NSW
+61-448-061-727
India
C130 Sector 2 Noida, Uttar Pradesh 201301
+91-723-689-1189
Philippines
40th Floor, PBCom Tower, 6795 Ayala Avenue Cor V.A Rufino St. Makati City, 1226.
+63-287-899-028, +63-967-048-3306
United Kingdom
6 Gardner Place, Becketts Close, Feltham TW14 0BX, Greater London
+44-753-713-2163
Vietnam
193/26/4 St.no.6, Ward Binh Hung Hoa, Binh Tan District, Ho Chi Minh City
+84-865-399-124


Share