

Consumer Insights
Uncover trends and behaviors shaping consumer choices today
Procurement Insights
Optimize your sourcing strategy with key market data
Industry Stats
Stay ahead with the latest trends and market analysis.
Trending Now


The global over the top (OTT) market attained a value of USD 124.72 Billion in 2024. The market is further expected to grow in the forecast period of 2025-2034 at a CAGR of 15.00% to reach USD 504.56 Billion by 2034.
Base Year
Historical Year
Forecast Year


Value in USD Billion
2025-2034
Over The Top (OTT) Market Outlook
*this image is indicative*
The market is primarily being driven by the rising penetration of the internet in the global market. The Asia Pacific is likely to witness the highest CAGR in the forecast period.


Over the top (OTT) services provide content from third-party providers like video, audio, text, and imagery over the internet:
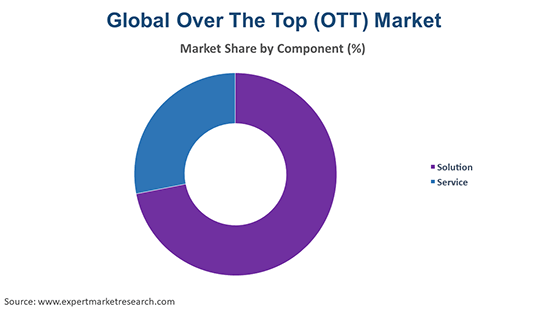
Market Breakup by Component:
Market Breakup by Device:
Market Breakup by Content Type:
Market Breakup by Revenue Model:
Market Breakup by Application:
Market Breakup by End Use:
Market Breakup by Region:
Read more about this report - REQUEST FREE SAMPLE COPY IN PDF
The EMR report looks into the regional markets like North America, Latin America, Europe, the Middle East and Africa, and the Asia Pacific.
The growing penetration of mobile computer equipment will drive the industry growth. The increasing penetration of mobile computing devices worldwide is driven by factors like higher per capita incomes, access to low-cost smartphones, increased internet penetration, as well as the rising investment in communication network infrastructure. The preferred choice for accessing VoIP, email, and images, as well as audio and video content, over OTT platforms is mobile computing devices like smartphones, laptops, and tablets. Several market vendors have been encouraged to develop mobile apps to stream OTT services via mobile computer devices. Such apps have portability, ease of access, and better connectivity than websites. The growth of mobile computer devices is, therefore, expected to boost the growth of the over the top (OTT) industry during the forecast period. However, the market growth can be impeded by the shortage of data network capacity and latency issues.
The report presents a detailed analysis of the following key players in the global over the top (OTT) industry, looking into their capacity, competitive landscape, and latest developments like capacity expansions, plant turnarounds, and mergers and acquisitions:
The EMR report gives an in-depth insight into the industry by providing a SWOT analysis as well as an analysis of Porter’s Five Forces model.
Saudi Arabia Silica Sand Market
Over the Top (OTT) Market Size
*While we strive to always give you current and accurate information, the numbers depicted on the website are indicative and may differ from the actual numbers in the main report. At Expert Market Research, we aim to bring you the latest insights and trends in the market. Using our analyses and forecasts, stakeholders can understand the market dynamics, navigate challenges, and capitalize on opportunities to make data-driven strategic decisions.*
Get in touch with us for a customized solution tailored to your unique requirements and save upto 35%!
In 2024, the global over the top (OTT) market attained a value of nearly USD 124.72 billion.
The market is projected to grow at a CAGR of 15% between 2025 and 2034.
The market is estimated to witness a healthy growth in the forecast period of 2025-2034 to reach about USD 439.49 billion by 2034.
The major drivers of the market are rising penetration of the internet in the global market, access to low-cost smartphones, and the rising investments in communication network infrastructure.
The key trends guiding the growth of the market includes the availability of various OTT providers and higher per capita incomes.
The major regions in the market are North America, Latin America, the Middle East and Africa, Europe, and the Asia Pacific.
The leading components of over the top (OTT) in the market are solution and service.
The various devices of over the top (OTT) include smartphones, smart TVs, desktops and tablets, gaming consoles, and set-top box, among others.
The significant content types of over the top (OTT) in the market are video, audio/VoIP, games, and communication, among others.
The leading revenue models of over the top (OTT) in the market are subscription, advertisement, and hybrid, among others.
The major applications of over the top (OTT) are personal and commercial.
The significant end uses of over the top (OTT) are media and entertainment, education and training, health and fitness, IT and telecom, e-commerce, BFSI, and government, among others.
The major players in the global over the top (OTT) market are Amazon Web Services, Inc., Netflix, Inc., Hulu, LLC, Telstra Corporation Limited, Apple Inc., Google LLC, and Rakuten Group, Inc., among others.
Explore our key highlights of the report and gain a concise overview of key findings, trends, and actionable insights that will empower your strategic decisions.
| REPORT FEATURES | DETAILS |
| Base Year | 2024 |
| Historical Period | 2018-2024 |
| Forecast Period | 2025-2034 |
| Scope of the Report |
Historical and Forecast Trends, Industry Drivers and Constraints, Historical and Forecast Market Analysis by Segment:
|
| Breakup by Component |
|
| Breakup by Device |
|
| Breakup by Content Type |
|
| Breakup by Revenue Model |
|
| Breakup by Application |
|
| Breakup by End Use |
|
| Breakup by Region |
|
| Market Dynamics |
|
| Competitive Landscape |
|
| Companies Covered |
|
| Report Price and Purchase Option | Explore our purchase options that are best suited to your resources and industry needs. |
| Delivery Format | Delivered as an attached PDF and Excel through email, with an option of receiving an editable PPT, according to the purchase option. |
Datasheet
One User
USD 2,499
USD 2,249
tax inclusive*
Single User License
One User
USD 3,999
USD 3,599
tax inclusive*
Five User License
Five User
USD 4,999
USD 4,249
tax inclusive*
Corporate License
Unlimited Users
USD 5,999
USD 5,099
tax inclusive*
*Please note that the prices mentioned below are starting prices for each bundle type. Kindly contact our team for further details.*
Flash Bundle
Small Business Bundle
Growth Bundle
Enterprise Bundle
*Please note that the prices mentioned below are starting prices for each bundle type. Kindly contact our team for further details.*
Flash Bundle
Number of Reports: 3
20%
tax inclusive*
Small Business Bundle
Number of Reports: 5
25%
tax inclusive*
Growth Bundle
Number of Reports: 8
30%
tax inclusive*
Enterprise Bundle
Number of Reports: 10
35%
tax inclusive*
How To Order
Our step-by-step guide will help you select, purchase, and access your reports swiftly, ensuring you get the information that drives your decisions, right when you need it.

Select License Type
Choose the right license for your needs and access rights.

Click on ‘Buy Now’
Add the report to your cart with one click and proceed to register.

Select Mode of Payment
Choose a payment option for a secure checkout. You will be redirected accordingly.
Track prices with detailed trend reports.

Analyse trade data for supply chain insights.

Leverage cost reports for smart savings

Enhance supply chain with partnerships.

Gain insights to stay ahead and seize opportunities.

Get insights & trends for a competitive edge.

Track prices with detailed trend reports.
Analyse trade data for supply chain insights.
Leverage cost reports for smart savings
Enhance supply chain with partnerships.
Gain insights to stay ahead and seize opportunities.
Get insights & trends for a competitive edge.
Track prices with detailed trend reports.
Analyse trade data for supply chain insights.
Connect For More Information
Our expert team of analysts will offer full support and resolve any queries regarding the report, before and after the purchase.
Our expert team of analysts will offer full support and resolve any queries regarding the report, before and after the purchase.
We employ meticulous research methods, blending advanced analytics and expert insights to deliver accurate, actionable industry intelligence, staying ahead of competitors.
Our skilled analysts offer unparalleled competitive advantage with detailed insights on current and emerging markets, ensuring your strategic edge.
We offer an in-depth yet simplified presentation of industry insights and analysis to meet your specific requirements effectively.
Australia
63 Fiona Drive, Tamworth, NSW
+61-448-061-727
India
C130 Sector 2 Noida, Uttar Pradesh 201301
+91-723-689-1189
Philippines
40th Floor, PBCom Tower, 6795 Ayala Avenue Cor V.A Rufino St. Makati City,1226.
+63-287-899-028, +63-967-048-3306
United Kingdom
6 Gardner Place, Becketts Close, Feltham TW14 0BX, Greater London
+44-753-713-2163
United States
30 North Gould Street, Sheridan, WY 82801
+1-415-325-5166
Vietnam
193/26/4 St.no.6, Ward Binh Hung Hoa, Binh Tan District, Ho Chi Minh City
+84-865-399-124
United States (Head Office)
30 North Gould Street, Sheridan, WY 82801
+1-415-325-5166
Australia
63 Fiona Drive, Tamworth, NSW
+61-448-061-727
India
C130 Sector 2 Noida, Uttar Pradesh 201301
+91-723-689-1189
Philippines
40th Floor, PBCom Tower, 6795 Ayala Avenue Cor V.A Rufino St. Makati City, 1226.
+63-287-899-028, +63-967-048-3306
United Kingdom
6 Gardner Place, Becketts Close, Feltham TW14 0BX, Greater London
+44-753-713-2163
Vietnam
193/26/4 St.no.6, Ward Binh Hung Hoa, Binh Tan District, Ho Chi Minh City
+84-865-399-124


Share