

Consumer Insights
Uncover trends and behaviors shaping consumer choices today
Procurement Insights
Optimize your sourcing strategy with key market data
Industry Stats
Stay ahead with the latest trends and market analysis.

The global orthopaedic braces and supports market size reached around USD 4.72 Billion in 2025. The market is projected to grow at a CAGR of 4.20% between 2026 and 2035 to reach nearly USD 7.12 Billion by 2035.
Base Year
Historical Period
Forecast Period
Compound Annual Growth Rate
4.2%
Value in USD Billion
2026-2035
*this image is indicative*
Read more about this report - REQUEST FREE SAMPLE COPY IN PDF
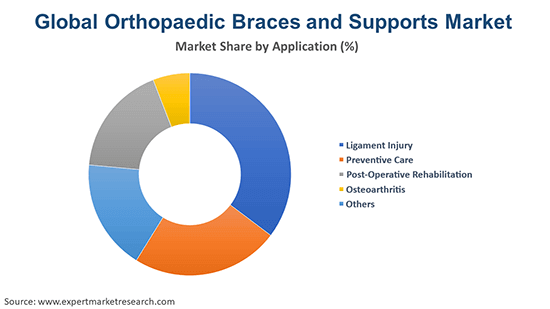
Based on type, soft and elastic braces and supports dominated the market in 2020. Based on the application, the ligament injury segment accounted for the highest market share in 2020. On the basis of end-users, orthopaedic clinics held the largest market share in 2020. North America accounted for the major market share in 2020 and is estimated to retain its dominance over the forecast period of 2026-2035.
Read more about this report - REQUEST FREE SAMPLE COPY IN PDF
Braces and supports are orthopaedic equipment that are used externally to hold, align, correct, and support certain parts of the body while healing from an injury. They are manufactured using specialised materials with precise designs that offer strong targeted support to the knee, shoulder, spine, foot, upper elbow, hip, ankle, and other body parts. they further aid in safeguarding the joints after surgeries and provide a sense of mobility to the patients.
On the basis of product types, the industry is segmented into:
Based on types, the market can be broadly categorised into:
Based on applications, the industry is categorised as:
On the basis of end use, the industry can be segregated into:
The EMR report looks into the regional markets for orthopaedic braces and supports like:


In comparison to invasive treatments, braces and supports help in reducing the incidences of post-surgical complications and assist in quick recovery. Also, consumers spend a significant part of their day in front of TVs and PCs, which results in the development of minor and major musculoskeletal deformities. Thus, the demand for braces and supports is increasing at a healthy rate.
The growing geriatric population is also contributing to the increased sales of braces and supports across the globe. The rising demand for orthopaedic softgoods such as wrist and wrist-thumb support, knee braces and wraps with flexible and rigid support, (tennis) elbow straps, and ankle supports are expected to aid the market growth. Technological advancements have also led to significant improvements in modelling and material technology and ensure increased flexibility while utilising low-weight materials. Also, the incorporation of advanced data sensors and synchronization systems are further expected to impel the industry growth over the forecast period.
The report presents a detailed analysis of the following key players in the global orthopaedic braces and supports market, looking into their capacity, market shares, and latest developments like capacity expansions, plant turnarounds, and mergers and acquisitions:
The comprehensive report looks into the macro and micro aspects of the industry. The EMR report gives an in-depth insight into the industry by providing a SWOT analysis as well as an analysis of Porter’s Five Forces model.


Upto 15% Off
USD
$3299 $2969
$5499 $4949
$6999 $5949
$8199 $6969


*While we strive to always give you current and accurate information, the numbers depicted on the website are indicative and may differ from the actual numbers in the main report. At Expert Market Research, we aim to bring you the latest insights and trends in the market. Using our analyses and forecasts, stakeholders can understand the market dynamics, navigate challenges, and capitalize on opportunities to make data-driven strategic decisions.*
Get in touch with us for a customized solution tailored to your unique requirements and save upto 35%!
In 2025, the market attained a value of nearly USD 4.72 Billion.
The market is assessed to grow at a CAGR of 4.20% between 2026 and 2035.
The market is estimated to witness a healthy growth in the forecast period of 2026-2035 to reach about USD 7.12 Billion by 2035.
The major drivers of the industry such as rising disposable incomes, increasing population, rising demand for the products due to the largely sedentary lifestyles of the consumers, and growing geriatric population are expected to aid the market growth.
Technological advancements leading to the development of improved modelling and material technology and the inclusion of advanced data sensors and synchronization systems are the major trends driving the growth of the market.
The major regions in the industry are North America, the Asia Pacific, Europe, Latin America, and the Middle East and Africa, with North America accounting for the largest market share.
The leading types of the products in the industry are soft and elastic braces and supports.
Lower extremity, spinal, and upper extremity braces and supports are the most significant product types in the industry.
Orthopaedic clinics are the leading end-users in the industry.
The ligament injury segment accounts for the largest market share among other application segments.
The major players in the industry are BREG, Inc., Össur Corporate, Bauerfeind AG, BSN medical GmbH, DJO Global, Inc., and 3M Company, among others.
Explore our key highlights of the report and gain a concise overview of key findings, trends, and actionable insights that will empower your strategic decisions.
| REPORT FEATURES | DETAILS |
| Base Year | 2025 |
| Historical Period | 2019-2025 |
| Forecast Period | 2026-2035 |
| Scope of the Report |
Historical and Forecast Trends, Industry Drivers and Constraints, Historical and Forecast Market Analysis by Segment:
|
| Breakup by Product |
|
| Breakup by Type |
|
| Breakup by Application |
|
| Breakup by End Use |
|
| Breakup by Region |
|
| Market Dynamics |
|
| Competitive Landscape |
|
| Companies Covered |
|
| Report Price and Purchase Option | Explore our purchase options that are best suited to your resources and industry needs. |
| Delivery Format | Delivered as an attached PDF and Excel through email, with an option of receiving an editable PPT, according to the purchase option. |
Datasheet
One User
USD 3,299
USD 2,969
tax inclusive*
Single User License
One User
USD 5,499
USD 4,949
tax inclusive*
Five User License
Five User
USD 6,999
USD 5,949
tax inclusive*
Corporate License
Unlimited Users
USD 8,199
USD 6,969
tax inclusive*
*Please note that the prices mentioned below are starting prices for each bundle type. Kindly contact our team for further details.*
Flash Bundle
Small Business Bundle
Growth Bundle
Enterprise Bundle
*Please note that the prices mentioned below are starting prices for each bundle type. Kindly contact our team for further details.*
Flash Bundle
Number of Reports: 3
20%
tax inclusive*
Small Business Bundle
Number of Reports: 5
25%
tax inclusive*
Growth Bundle
Number of Reports: 8
30%
tax inclusive*
Enterprise Bundle
Number of Reports: 10
35%
tax inclusive*
How To Order

Select License Type
Choose the right license for your needs and access rights.

Click on ‘Buy Now’
Add the report to your cart with one click and proceed to register.

Select Mode of Payment
Choose a payment option for a secure checkout. You will be redirected accordingly.
Gain insights to stay ahead and seize opportunities.

Get insights & trends for a competitive edge.

Track prices with detailed trend reports.

Analyse trade data for supply chain insights.

Leverage cost reports for smart savings

Enhance supply chain with partnerships.

Connect For More Information
Our expert team of analysts will offer full support and resolve any queries regarding the report, before and after the purchase.
Our expert team of analysts will offer full support and resolve any queries regarding the report, before and after the purchase.
We employ meticulous research methods, blending advanced analytics and expert insights to deliver accurate, actionable industry intelligence, staying ahead of competitors.
Our skilled analysts offer unparalleled competitive advantage with detailed insights on current and emerging markets, ensuring your strategic edge.
We offer an in-depth yet simplified presentation of industry insights and analysis to meet your specific requirements effectively.


Share