

Consumer Insights
Uncover trends and behaviors shaping consumer choices today
Procurement Insights
Optimize your sourcing strategy with key market data
Industry Stats
Stay ahead with the latest trends and market analysis.

The oil pressure control solenoid valve market is projected to grow at a CAGR of 4.00% during the period of 2026-2035 to reach a value of USD 5.85 Billion by 2035.
Base Year
Historical Period
Forecast Period
Compound Annual Growth Rate
4%
2026-2035
*this image is indicative*
Read more about this report - REQUEST FREE SAMPLE COPY IN PDF
With the growing investments in the oil and gas sector, the demand for oil pressure control solenoid valves is expected to grow in the coming years. They find their application right from the extraction of crude oil and gas till they reach the customers via refinery and oil terminals and depots. Additionally, the increased automation and technological advancements are expected to drive the oil pressure control solenoid valve market forward. Moreover, the increasing government regulations on the industries, such as oil and gas, are expected to drive the industry forward. The government regulations have prioritised the safety factors. Therefore, there have been significant enhancements in the safety features of the valves, such as detecting internal and external leakages.
Read more about this report - REQUEST FREE SAMPLE COPY IN PDF
Oil pressure control solenoid valve is a valve that is operated electromechanically, that is, it can be controlled by an electric current flowing through a solenoid, which, in turn, creates a magnetic field to open or close the plunger mechanism. They are often used as control elements in aqueous and gaseous fluids and the automotive industry.
Based on design, the market can be divided into:
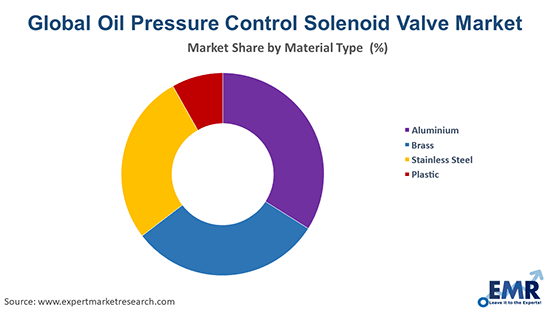
Based on material type, the industry is segmented into:
Based on end use, the market is divided into:
The regional markets for the product include:


The significant use of oil pressure control solenoid valve in various end-use industries like oil and gas, water treatment, and chemicals, is driving the market forward. As new industries are joining the market, there has been a rise in new control designs for the components and improvements in the existing structures of oil pressure control solenoid valves, taking the market forward. Increased automation in almost every sector is acting as a catalyst to the market growth. The increasing government regulations on oil and gas are also aiding the market. The increased safety awareness in these industries has led to the increased usage of these valves; thus, further aiding the market growth.
The report gives a detailed analysis of the following key players in the global oil pressure control solenoid valve market, covering their competitive landscape, capacity, and latest developments like mergers, acquisitions, and investments, expansions of capacity, and plant turnarounds:
The comprehensive EMR report provides an in-depth assessment of the industry based on Porter's five forces model, along with giving a SWOT analysis.


Upto 15% Off
USD
$2499 $2249
$3999 $3599
$4999 $4249
$5999 $5099


*While we strive to always give you current and accurate information, the numbers depicted on the website are indicative and may differ from the actual numbers in the main report. At Expert Market Research, we aim to bring you the latest insights and trends in the market. Using our analyses and forecasts, stakeholders can understand the market dynamics, navigate challenges, and capitalize on opportunities to make data-driven strategic decisions.*
Get in touch with us for a customized solution tailored to your unique requirements and save upto 35%!
The global market for oil pressure control solenoid valve is being aided by the solenoid valve market, which is projected to grow at a CAGR of 4.00% between 2026 and 2035.
The solenoid valve market is estimated to reach about USD 5.85 Billion by 2035, continuing to support the growth of the pressure control solenoid valve industry.
The major drivers of the industry, such as the increasing applications in various end-use industries, improvements in designs, and favourable government regulations, are expected to aid the market growth.
The key market trend guiding the growth of the market is the increasing usage in industries and changed designs for components.
The major regions in the industry are North America, Europe, the Asia Pacific, Latin America, and the Middle East and Africa.
The leading product design types in the industry are 2-way, 3-way, 4-way, and 5-way valves.
The major material segments in the market include aluminium, brass, stainless steel, and plastic.
The major end-use sectors in the industry are oil and gas, chemical and petrochemical, food and beverage, pharmaceutical and biotechnology, power generation, and water and wastewater treatment, among others.
The major players in the industry are Mitsubishi Electric Corporation, Rotex Automation, Siemens Aktiengesellschaft, SMC Corporation of America, Parker Hannifin Corp., and Burkert Contromatic Pvt. Ltd., among others.
Explore our key highlights of the report and gain a concise overview of key findings, trends, and actionable insights that will empower your strategic decisions.
| REPORT FEATURES | DETAILS |
| Base Year | 2025 |
| Historical Period | 2019-2025 |
| Forecast Period | 2026-2035 |
| Scope of the Report |
Historical and Forecast Trends, Industry Drivers and Constraints, Historical and Forecast Market Analysis by Segment:
|
| Breakup by Design |
|
| Breakup by Material Type |
|
| Breakup by End Use |
|
| Breakup by Region |
|
| Market Dynamics |
|
| Competitive Landscape |
|
| Companies Covered |
|
| Report Price and Purchase Option | Explore our purchase options that are best suited to your resources and industry needs. |
| Delivery Format | Delivered as an attached PDF and Excel through email, with an option of receiving an editable PPT, according to the purchase option. |
Datasheet
One User
USD 2,499
USD 2,249
tax inclusive*
Single User License
One User
USD 3,999
USD 3,599
tax inclusive*
Five User License
Five User
USD 4,999
USD 4,249
tax inclusive*
Corporate License
Unlimited Users
USD 5,999
USD 5,099
tax inclusive*
*Please note that the prices mentioned below are starting prices for each bundle type. Kindly contact our team for further details.*
Flash Bundle
Small Business Bundle
Growth Bundle
Enterprise Bundle
*Please note that the prices mentioned below are starting prices for each bundle type. Kindly contact our team for further details.*
Flash Bundle
Number of Reports: 3
20%
tax inclusive*
Small Business Bundle
Number of Reports: 5
25%
tax inclusive*
Growth Bundle
Number of Reports: 8
30%
tax inclusive*
Enterprise Bundle
Number of Reports: 10
35%
tax inclusive*
How To Order

Select License Type
Choose the right license for your needs and access rights.

Click on ‘Buy Now’
Add the report to your cart with one click and proceed to register.

Select Mode of Payment
Choose a payment option for a secure checkout. You will be redirected accordingly.
Gain insights to stay ahead and seize opportunities.

Get insights & trends for a competitive edge.

Track prices with detailed trend reports.

Analyse trade data for supply chain insights.

Leverage cost reports for smart savings

Enhance supply chain with partnerships.

Connect For More Information
Our expert team of analysts will offer full support and resolve any queries regarding the report, before and after the purchase.
Our expert team of analysts will offer full support and resolve any queries regarding the report, before and after the purchase.
We employ meticulous research methods, blending advanced analytics and expert insights to deliver accurate, actionable industry intelligence, staying ahead of competitors.
Our skilled analysts offer unparalleled competitive advantage with detailed insights on current and emerging markets, ensuring your strategic edge.
We offer an in-depth yet simplified presentation of industry insights and analysis to meet your specific requirements effectively.


Share