

Consumer Insights
Uncover trends and behaviors shaping consumer choices today
Procurement Insights
Optimize your sourcing strategy with key market data
Industry Stats
Stay ahead with the latest trends and market analysis.
Trending Now


The global nuclear power plant and equipment market attained a value of USD 40.63 Billion in 2024. The market is estimated to grow at a CAGR of 6.84% during 2025-2034 to reach a value of USD 78.74 Billion by 2034.
Base Year
Historical Period
Forecast Period
Nuclear power is regarded as a crucial low-emission energy source, accounting for around 10% of global electricity generation in 2023.
In 2022, global nuclear power capacity grew by approximately 1.5 GW, reflecting a 0.3% year-on-year increase, as new capacity additions surpassed over 6 GW of retirements.
As of 2024, about 60 reactors are under construction across the globe, and an additional 110 are planned.


Value in USD Billion
2025-2034
Nuclear Power Plant and Equipment Market Outlook
*this image is indicative*
| Global Nuclear Power Plant and Equipment Market Report Summary | Description | Value |
| Base Year | USD Billion | 2024 |
| Historical Period | USD Billion | 2018-2024 |
| Forecast Period | USD Billion | 2025-2034 |
| Market Size 2024 | USD Billion | 40.63 |
| Market Size 2034 | USD Billion | 78.74 |
| CAGR 2018-2024 | Percentage | XX% |
| CAGR 2025-2034 | Percentage | 6.84% |
| CAGR 2025-2034 - Market by Region | Middle East and Africa | 13.7% |
| CAGR 2025-2034 - Market by Region | North America | 5.8% |
| CAGR 2025-2034 - Market by Wafer Type | Auxiliary Equipment | 7.5% |
| CAGR 2025-2034 - Market by Application | Military | 8.1% |
| CAGR 2025-2034 - Market by Country | UAE | 14.1% |
| 2024 Market Share by Country | China | 21.0% |
The nuclear power plant and equipment market is driven by the growing demand for electricity from low-carbon sources and the growth in the construction of nuclear reactors.
Read more about this report - REQUEST FREE SAMPLE COPY IN PDF
As of July 2023, nuclear power accounted for about 10% of the electricity production globally, primarily led by advanced economies. By 2024, the global electricity demand is projected to increase by around 4%, up from 2.3% in 2023, leading to further opportunities for electricity production from nuclear sources.
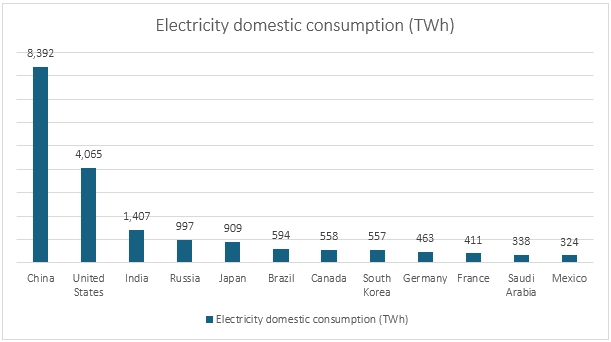
Figure: Domestic Electricity Consumption (TWh) by Country; 2023
Between 2020 and 2035, China aims to construct 150 new nuclear reactors. According to the International Atomic Energy Agency (IAEA), as of September 2024, around 54 pressurized light-water moderated and cooled reactor have been installed globally. As of 2024, China and India hold the most number of reactors under construction globally, accounting for 28 and 7 units, respectively.
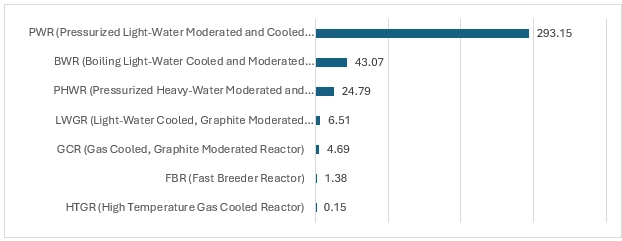
Figure: Operational Reactors and Their Net Electric Capacity (GW) by Type; 2024
Global electricity consumption increased by 2.6% in 2023, aligning with the typical annual growth rate of about 2.7%. China's consumption grew by more than 6.9%, representing one-third of global usage, while India saw a 6.7% rise and Brazil 3.2%, driven by strong economic growth and higher demand in sectors like cooling in India and Brazil, and irrigation in India.
Presence of favourable government policies; adoption of new technologies; nuclear power modernisation attempts; and increasing demand for electricity are the key trends impacting the nuclear power plant and equipment market demand
Being a low-carbon source, governments globally are focusing on nuclear power to achieve their decarbonisation goals. For instance, the Inflation Reduction Act signed into law in August 2022 in the USA supports existing and new nuclear development through investment and tax incentives for large existing nuclear plants and newer advanced reactors.
Innovation in advanced reactor designs offers enhanced safety features. Small modular reactors, fast reactors, and thorium reactors increase flexibility in capacity and integrate energy systems by enabling novel fuel cycle solutions.
The upgrades in nuclear plant projects drive the demand for new equipment. As of July 2024, about 60 reactors are under construction, and 110 reactors are planned for modernization globally, in which most construction is planned in Asia.
As of July 2023, it accounted for approximately 10% of global electricity production. Nuclear power supplies electricity to 28 U.S. states and supports various non-electric applications, including medical and space exploration. In 2022, nuclear power contributed 22% to the EU’s electricity generation.
Increasing energy demands create opportunities for nuclear power to play a larger role in diversifying energy sources. The U.S. Department of Energy (DOE) projects an additional 200 GW of nuclear capacity to reach net-zero emissions by 2050. Some of the nuclear power can be potentially produced at or near retiring coal plants. As of 2024, around 30% of the USA’s coal-fired power plants are projected to retire by 2035. According to the DOE, over 300 existing and retired coal power plant sites are suitable to host advanced nuclear power plants in the USA.
SMRs have a power capacity of up to 300 MW(e) per unit, which is about 1/3rd of the generating capacity of traditional nuclear power reactors. SMRs are advantageous due to their small and modular design. Prefabricated units reduce construction costs and delays compared to custom-designed reactors. Limited grid coverage and high connection costs hinder rural electrification. SMRs can address this by being installed on existing grids or off-grid, offering low-carbon power in areas with inadequate transmission infrastructure. SMRs have reduced fuel needs, requiring refueling every 3 to 7 years, compared to 1 to 2 years for conventional plants. SMrs are under construction or in the licensing stage in China, Russia, Argentina, Canada, South Korea, and the USA.
Read more about this report - REQUEST FREE SAMPLE COPY IN PDF
“Global Nuclear Power Plant and Equipment Market Report and Forecast 2025-2034” offers a detailed analysis of the market based on the following segments:
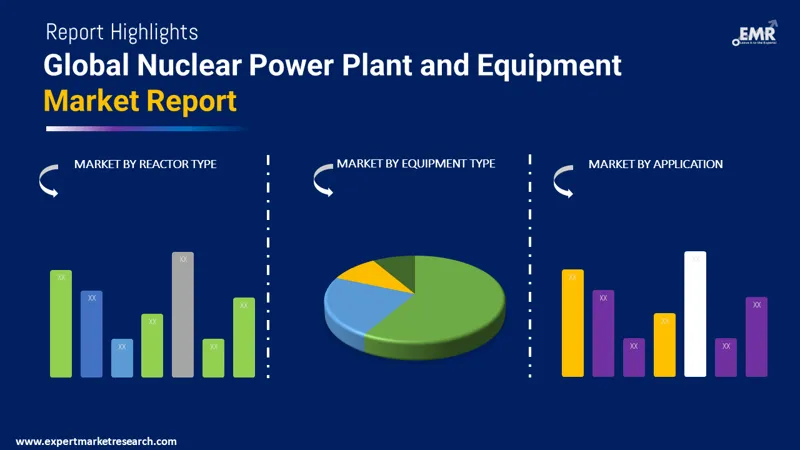
Market Breakup by Reactor Type
Market Breakup by Equipment Type
Market Breakup by Application
Market Breakup by Region
Based on application, public utilities account for a significant share of the nuclear power plant and equipment market
Nuclear power is being increasingly used to generate electricity, amidst the growing importance of net zero emissions. In 2022, the nuclear reactors in the United States contributed to 18% of total electrical output, whereas in the UK, the nuclear power provided 13.9% of total electricity supplied in 2022. In 2023, nuclear reactors generated a total of 2,602 TWh of electricity, an increase from 2,544 TWh in 2022.
Governments such as Russia and China are developing microreactors for propulsion. By 2030, the US army aims to deploy prototype microreactor nuclear power plant at an installation in the continental U.S. Nuclear power is being used for powerful submarine propulsion. As of February 2023, globally, over 160 ships were powered by over 200 small nuclear reactors.
Based on reactor type, pressurised water reactor is a major contributor to the global nuclear power plant and equipment market revenue
A pressurised water reactor (PWR) has fuel assemblies of 200-300 rods each, which are arranged vertically in the core. Typically, a large reactor has the presence of about 150-250 fuel assemblies with 80-100 tonnes of uranium. The nuclear island equipment includes a reactor pressure vessel, steam generator, and pressurizer. As of April 2022, the total number of Pressurized Light-Water Moderated and Cooled Reactors across the globe were recorded at 306.
The Pressurised Heavy Water Reactors (PHWRs) are typically fuelled by natural uranium. Typically, for a 700 MW PHWR (at 85% Capacity Factor), the annual requirement of fuel (UO2) is about 125 tons.
The market players are focusing on providing equipment with advanced features and technologies.
BWXT provides precision-manufactured components, services, and fuel to the commercial nuclear power industry, serving clients across four continents. The company has a workforce of more than 7,000 employees and operates 14 key sites in the U.S., Canada, and the U.K., highlighting its extensive global presence.
ROSATOM is a diversified global leader in the nuclear energy industry, based in Russia. The company owns assets and possesses comprehensive competencies across all stages of the nuclear production chain. As a global leader in nuclear power plant construction, the company manages 39 power units in 10 countries.
Dongfang Electric plays a major role in the electric power industry, supplying around one-third of China's energy equipment. As of 2024, DEC holds over 50% of the market share for conventional island equipment and 30% for nuclear island equipment in China's domestic market.
Founded in 2007, NuScale Power Corp. specializes in the development of small modular reactors (SMRs), focusing on scalable nuclear energy solutions. The company has a global reach, with its small modular reactor technology attracting interest from countries across North America, Europe, Asia, and the Middle East.
*Please note that this is only a partial list; the complete list of key players is available in the full report. Additionally, the list of key players can be customized to better suit your needs.*
Other notable players operating in the global nuclear power plant and equipment market are GE Vernova Inc, Korea Electric Power Corporation, Toshiba Energy Systems & Solutions Corporation, Mitsubishi Heavy Industries, Ltd, Larsen & Toubro Limited, and Doosan Enerbility Co., Ltd, among others.


Asia is expected to dominate the nuclear capacity installations by 2033 installing over 49 GW, as China, India, and Japan make huge investments towards clean energy solutions. As of August 2024, Asia has 145 operational nuclear power reactors and 45 under construction.
| CAGR 2025-2034 - Market by | Country |
| UAE | 14.1% |
| China | 10.4% |
| Canada | 6.2% |
| UK | 5.5% |
| Russia | 5.4% |
| USA | XX% |
| France | XX% |
| Japan | XX% |
| India | XX% |
| South Korea | 4.8% |
| South Africa | XX% |
| Brazil | XX% |
| Mexico | 3.7% |
EU regulators are increasingly advocating nuclear power as a key solution for reducing greenhouse gas emissions and achieving carbon neutrality in Europe by 2050. In 2022, nuclear power accounted for 22% of the EU’s energy mix.
Opportunities for nuclear energy in North America include its ability to provide a reliable power source and its low emissions profile compared to fossil fuels. As of 2023, nuclear energy meets 20% of the electricity demand in the United States and 15% in Canada.
*While we strive to always give you current and accurate information, the numbers depicted on the website are indicative and may differ from the actual numbers in the main report. At Expert Market Research, we aim to bring you the latest insights and trends in the market. Using our analyses and forecasts, stakeholders can understand the market dynamics, navigate challenges, and capitalize on opportunities to make data-driven strategic decisions.*
Get in touch with us for a customized solution tailored to your unique requirements and save upto 35%!
The global market for nuclear power plant and equipment attained a value of USD 40.63 Billion in 2024.
The market is estimated to grow at a CAGR of 6.84% during 2025-2034.
The market is estimated to witness a healthy growth in the forecast period of 2025-2034 to reach a value of USD 78.74 Billion by 2034.
The factors driving the market growth are rising demand for electricity, favourable government initiatives, and rising technological advancements.
The key trends fuelling the market include increasing government support for the development of sustainable energy generation and strict regulations to reduce carbon emissions.
The key regional markets for nuclear power plant and equipment are North America, Europe, the Asia Pacific, Latin America, and the Middle East and Africa.
The applications include military, public utilities, and others.
The key players in the market include BWX Technologies, Inc., The State Atomic Energy Corporation Rosatom (ROSATOM), Dongfang Electric Co., Ltd., Nuscale Power Corp., GE Vernova Inc, Korea Electric Power Corporation, Toshiba Energy Systems & Solutions Corporation, Mitsubishi Heavy Industries, Ltd, Larsen & Toubro Limited, and Doosan Enerbility Co., Ltd, among others.
The equipment includes island equipment and auxiliary equipment.
Explore our key highlights of the report and gain a concise overview of key findings, trends, and actionable insights that will empower your strategic decisions.
| REPORT FEATURES | DETAILS |
| Base Year | 2024 |
| Historical Period | 2018-2024 |
| Forecast Period | 2025-2034 |
| Scope of the Report |
Historical and Forecast Trends, Industry Drivers and Constraints, Historical and Forecast Market Analysis by Segment:
|
| Breakup by Reactor Type |
|
| Breakup by Equipment Type |
|
| Breakup by Application |
|
| Breakup by Region |
|
| Market Dynamics |
|
| Competitive Landscape |
|
| Companies Covered |
|
Datasheet
One User
USD 2,499
USD 2,249
tax inclusive*
Single User License
One User
USD 3,999
USD 3,599
tax inclusive*
Five User License
Five User
USD 4,999
USD 4,249
tax inclusive*
Corporate License
Unlimited Users
USD 5,999
USD 5,099
tax inclusive*
*Please note that the prices mentioned below are starting prices for each bundle type. Kindly contact our team for further details.*
Flash Bundle
Small Business Bundle
Growth Bundle
Enterprise Bundle
*Please note that the prices mentioned below are starting prices for each bundle type. Kindly contact our team for further details.*
Flash Bundle
Number of Reports: 3
20%
tax inclusive*
Small Business Bundle
Number of Reports: 5
25%
tax inclusive*
Growth Bundle
Number of Reports: 8
30%
tax inclusive*
Enterprise Bundle
Number of Reports: 10
35%
tax inclusive*
How To Order
Our step-by-step guide will help you select, purchase, and access your reports swiftly, ensuring you get the information that drives your decisions, right when you need it.

Select License Type
Choose the right license for your needs and access rights.

Click on ‘Buy Now’
Add the report to your cart with one click and proceed to register.

Select Mode of Payment
Choose a payment option for a secure checkout. You will be redirected accordingly.
Track prices with detailed trend reports.

Analyse trade data for supply chain insights.

Leverage cost reports for smart savings

Enhance supply chain with partnerships.

Gain insights to stay ahead and seize opportunities.

Get insights & trends for a competitive edge.

Track prices with detailed trend reports.
Analyse trade data for supply chain insights.
Leverage cost reports for smart savings
Enhance supply chain with partnerships.
Gain insights to stay ahead and seize opportunities.
Get insights & trends for a competitive edge.
Track prices with detailed trend reports.
Analyse trade data for supply chain insights.
Connect For More Information
Our expert team of analysts will offer full support and resolve any queries regarding the report, before and after the purchase.
Our expert team of analysts will offer full support and resolve any queries regarding the report, before and after the purchase.
We employ meticulous research methods, blending advanced analytics and expert insights to deliver accurate, actionable industry intelligence, staying ahead of competitors.
Our skilled analysts offer unparalleled competitive advantage with detailed insights on current and emerging markets, ensuring your strategic edge.
We offer an in-depth yet simplified presentation of industry insights and analysis to meet your specific requirements effectively.
Australia
63 Fiona Drive, Tamworth, NSW
+61-448-061-727
India
C130 Sector 2 Noida, Uttar Pradesh 201301
+91-723-689-1189
Philippines
40th Floor, PBCom Tower, 6795 Ayala Avenue Cor V.A Rufino St. Makati City,1226.
+63-287-899-028, +63-967-048-3306
United Kingdom
6 Gardner Place, Becketts Close, Feltham TW14 0BX, Greater London
+44-753-713-2163
United States
30 North Gould Street, Sheridan, WY 82801
+1-415-325-5166
Vietnam
193/26/4 St.no.6, Ward Binh Hung Hoa, Binh Tan District, Ho Chi Minh City
+84-865-399-124
United States (Head Office)
30 North Gould Street, Sheridan, WY 82801
+1-415-325-5166
Australia
63 Fiona Drive, Tamworth, NSW
+61-448-061-727
India
C130 Sector 2 Noida, Uttar Pradesh 201301
+91-723-689-1189
Philippines
40th Floor, PBCom Tower, 6795 Ayala Avenue Cor V.A Rufino St. Makati City, 1226.
+63-287-899-028, +63-967-048-3306
United Kingdom
6 Gardner Place, Becketts Close, Feltham TW14 0BX, Greater London
+44-753-713-2163
Vietnam
193/26/4 St.no.6, Ward Binh Hung Hoa, Binh Tan District, Ho Chi Minh City
+84-865-399-124


Share