

Consumer Insights
Uncover trends and behaviors shaping consumer choices today
Procurement Insights
Optimize your sourcing strategy with key market data
Industry Stats
Stay ahead with the latest trends and market analysis.
Base Year
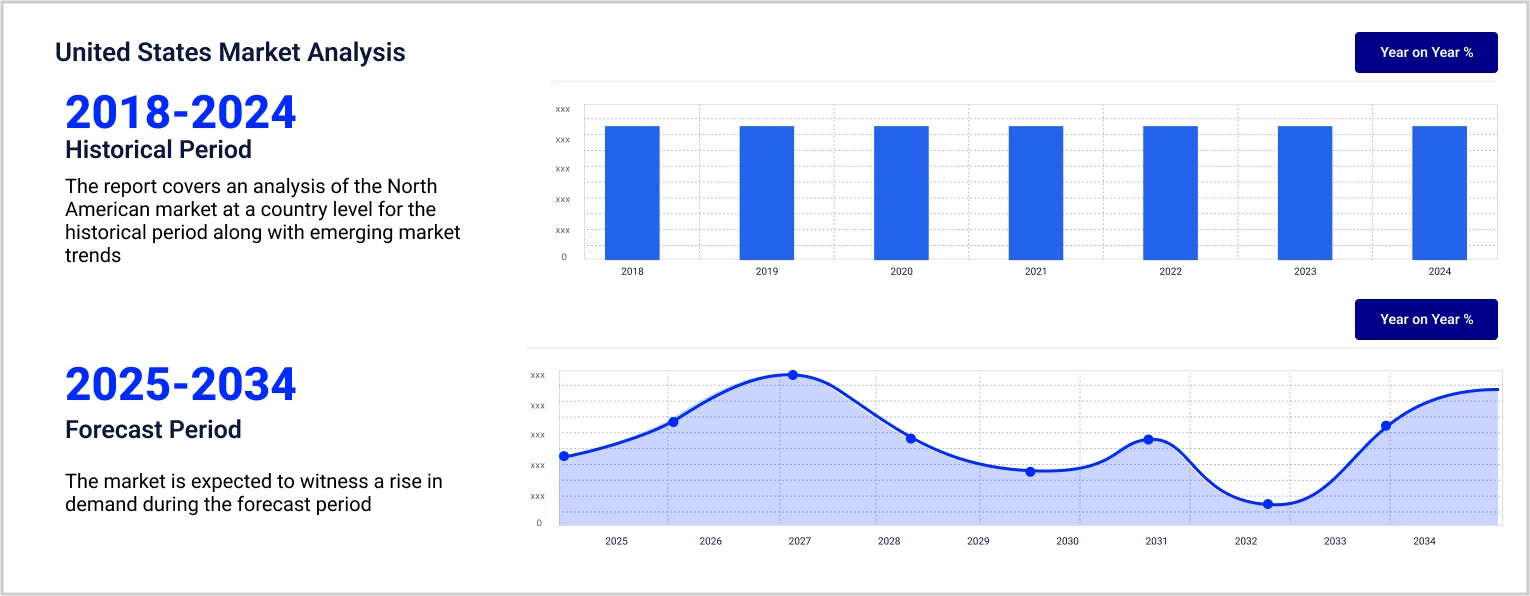
Historical Year
Forecast Year


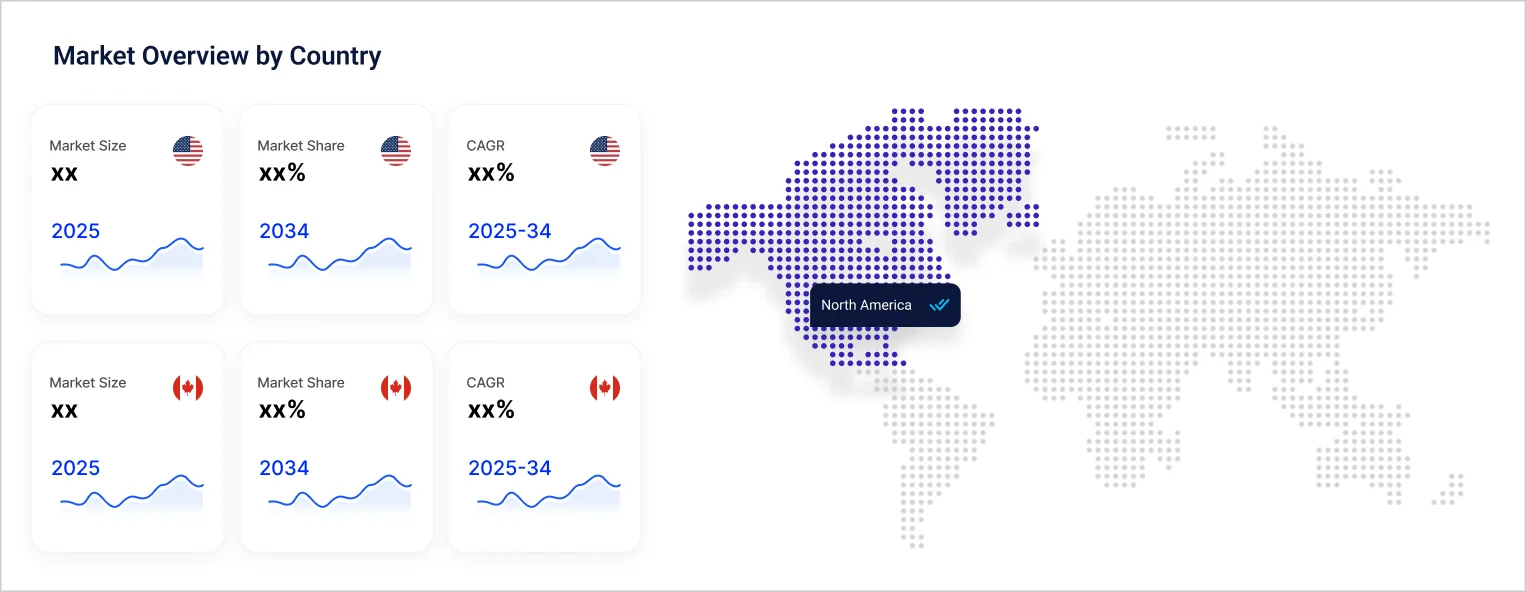
The North America webcam market reached around USD 2.64 billion in 2024. The market is projected to grow at a CAGR of 8.1% between 2025 and 2034 to reach nearly USD 5.33 billion by 2034.
| North America Webcam Market Report Summary | Description | Value |
| Base Year | USD Billion | 2023 |
| Historical Period | USD Billion | 2018-2024 |
| Forecast Period | USD Billion | 2025-2034 |
| Market Size 2024 | USD Billion | 2.64 |
| Market Size 2034 | USD Billion | 5.33 |
| CAGR 2018-2024 | Percentage | XX% |
| CAGR 2025-2034 | Percentage | 8.1% |
| CAGR 2025-2034 - Market by Country | United States | 8.0% |
| CAGR 2025-2034 - Market by End Use | Visual Marketing | 9.0% |
| CAGR 2025-2034 - Market by Distribution Channel | Online Channels | 16.3% |
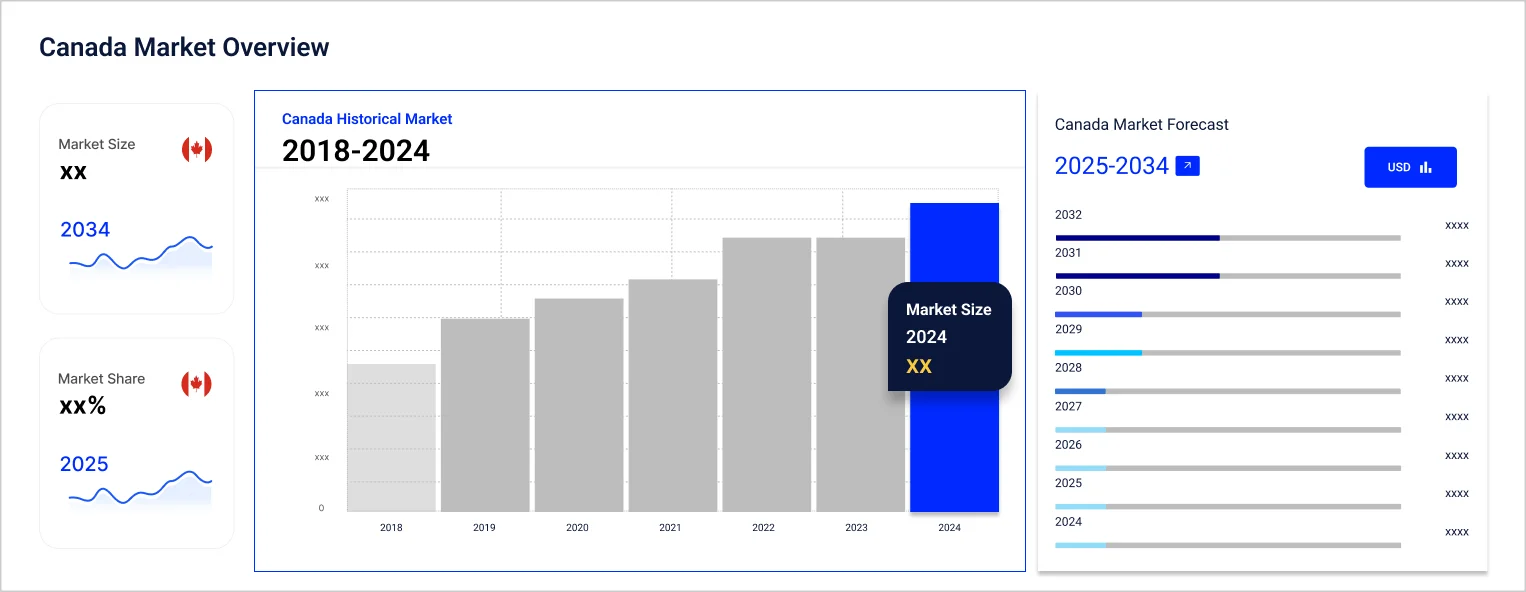
| 2024 Market Share by Country | Canada | 13.6% |
The National Opinion Research Centre at the University of Chicago found that in 2022, Americans spent nearly USD 394 billion on numerous outdoor activities like wildlife observation. Around 57% of the American population aged 16 years and above likes wildlife observation and took 1.7 billion trips to participate in such activities. In 2022, nearly 148 million people went for wildlife observation, which had an economic impact of USD 250 million on the USA’s economy. This is expected to favour the demand for webcams, as they enable non-intrusive monitoring of wild animals in their natural habitat.
Video conferencing tools have gained significant popularity among Canadians post the COVID-19 pandemic. Nearly 57% of the domestic population in Canada under 25 years old utilise video conferencing platforms for over an hour daily. 49% of Canadians report their reliance on video conferencing tools has increased substantially after 2020. 72% of Canadians prefer video calls over human interaction. This indicates significant potential for market growth over the forecast period.
The e-learning industry in Canada is estimated to have generated a revenue of CAD 6.925 billion in 2023. Nearly three-fourths of all Canadian universities provide online learning modules. Before the pandemic, over 90% of all Canadian universities were offering online programmes and courses. It is estimated that nearly 29% of all university students in Canada take online education courses. This is expected to drive the demand for webcams in the coming years.
North America Webcam Market Report and Forecast 2025-2034 offers a detailed analysis of the market based on the following segments:
Market Breakup by Webcam Type
Market Breakup by Technology
Market Breakup by End Use
| CAGR 2025-2034 - Market by | End Use |
| Visual Marketing | 9.0% |
| Security and Surveillance | XX% |
| Video Conference | XX% |
| Entertainment | XX% |
| Live Events | XX% |
| Others | XX% |
Market Breakup by Distribution Channel
| CAGR 2025-2034 - Market by | Distribution Channel |
| Online Channels | 16.3% |
| Offline Stores | XX% |
Market Breakup by Country
| CAGR 2025-2034 - Market by | Country |
| United States | 8.0% |
| Canada | XX% |
Based on country, the market is segmented into the United States and Canada. Canada is projected to dominate the market, representing 13.6% of the overall market share. Over the forecast period of 2025-2034, the United States is expected to grow at a CAGR of 8.0% due to the increasing government emphasis on boosting security measures in urban areas.
Digital webcams are witnessing widespread adoption due to the integration of AI-powered functionalities and the presence of enhanced security features, such as gesture control and facial recognition. The introduction of high-resolution webcams is further expected to play a significant role in driving the market growth.
| REPORT FEATURES | DETAILS |
| Base Year | 2023 |
| Historical Period | 2018-2024 |
| Forecast Period | 2025-2034 |
| Scope of the Report |
Historical and Forecast Trends, Industry Drivers and Constraints, Historical and Forecast Market Analysis by Segment:
|
| Breakup by Webcam Type |
|
| Breakup by Technology |
|
| Breakup by End Use |
|
| Breakup by Distribution Channel |
|
| Breakup by Region |
|
| Market Dynamics |
|
| Competitive Landscape |
|
| Companies Covered |
|
*While we strive to always give you current and accurate information, the numbers depicted on the website are indicative and may differ from the actual numbers in the main report. At Expert Market Research, we aim to bring you the latest insights and trends in the market. Using our analyses and forecasts, stakeholders can understand the market dynamics, navigate challenges, and capitalize on opportunities to make data-driven strategic decisions.*
Get in touch with us for a customized solution tailored to your unique requirements and save upto 35%!
The market reached nearly USD 2.64 billion in 2024.
The market is projected to grow at a CAGR of 8.1% between 2025 and 2034.
The market is assessed to witness healthy growth in the forecast period to reach around USD 5.33 billion in 2034.
The different types of webcams in the market are external webcam and embedded webcam.
The different segments based on technologies of webcam considered in the market report include analogue and digital.
The different distribution channels of webcams in the market are online and offline.
The different countries covered in the market report are the United States and Canada.
The key market players are Logitech S.A., Microsoft Corporation, Razer Inc., Creative Technology Ltd., HP Development Company, L.P., AVerMedia Technologies, Inc., Arashi Vision Inc., Lenovo Group Ltd., Dell, Inc., and Corsair Memory Inc., among others.
Datasheet
USD 2,199
USD 1,999
tax inclusive*
Single User License
One User
USD 3,299
USD 2,999
tax inclusive*
Five User License
Five Users
USD 4,399
USD 3,999
tax inclusive*
Corporate License
Unlimited Users
USD 5,499
USD 4,999
tax inclusive*
*Please note that the prices mentioned below are starting prices for each bundle type. Kindly contact our team for further details.*
Flash Bundle
Small Business Bundle
Growth Bundle
Enterprise Bundle
*Please note that the prices mentioned below are starting prices for each bundle type. Kindly contact our team for further details.*
Flash Bundle
Number of Reports: 3
20%
tax inclusive*
Small Business Bundle
Number of Reports: 5
25%
tax inclusive*
Growth Bundle
Number of Reports: 8
30%
tax inclusive*
Enterprise Bundle
Number of Reports: 10
35%
tax inclusive*
How To Order
Our step-by-step guide will help you select, purchase, and access your reports swiftly, ensuring you get the information that drives your decisions, right when you need it.

Select License Type
Choose the right license for your needs and access rights.

Click on ‘Buy Now’
Add the report to your cart with one click and proceed to register.

Select Mode of Payment
Choose a payment option for a secure checkout. You will be redirected accordingly.
Gain insights to stay ahead and seize opportunities.

Get insights & trends for a competitive edge.

Track prices with detailed trend reports.

Analyse trade data for supply chain insights.

Leverage cost reports for smart savings

Enhance supply chain with partnerships.

Connect For More Information
Our expert team of analysts will offer full support and resolve any queries regarding the report, before and after the purchase.
Our expert team of analysts will offer full support and resolve any queries regarding the report, before and after the purchase.
We employ meticulous research methods, blending advanced analytics and expert insights to deliver accurate, actionable industry intelligence, staying ahead of competitors.
Our skilled analysts offer unparalleled competitive advantage with detailed insights on current and emerging markets, ensuring your strategic edge.
We offer an in-depth yet simplified presentation of industry insights and analysis to meet your specific requirements effectively.
Australia
63 Fiona Drive, Tamworth, NSW
+61-448-061-727
India
C130 Sector 2 Noida, Uttar Pradesh 201301
+91-858-608-1494
Philippines
40th Floor, PBCom Tower, 6795 Ayala Avenue Cor V.A Rufino St. Makati City,1226.
+63-287-899-028, +63-967-048-3306
United Kingdom
6 Gardner Place, Becketts Close, Feltham TW14 0BX, Greater London
+44-753-713-2163
United States
30 North Gould Street, Sheridan, WY 82801
+1-415-325-5166
Vietnam
193/26/4 St.no.6, Ward Binh Hung Hoa, Binh Tan District, Ho Chi Minh City
+84-865-399-124
United States (Head Office)
30 North Gould Street, Sheridan, WY 82801
+1-415-325-5166
Australia
63 Fiona Drive, Tamworth, NSW
+61-448-061-727
India
C130 Sector 2 Noida, Uttar Pradesh 201301
+91-858-608-1494
Philippines
40th Floor, PBCom Tower, 6795 Ayala Avenue Cor V.A Rufino St. Makati City, 1226.
+63-287-899-028, +63-967-048-3306
United Kingdom
6 Gardner Place, Becketts Close, Feltham TW14 0BX, Greater London
+44-753-713-2163
Vietnam
193/26/4 St.no.6, Ward Binh Hung Hoa, Binh Tan District, Ho Chi Minh City
+84-865-399-124


Share