Add 2 More Reports For 20% off

Report Overview

2024

Base Year

2018-2024

Historical Year

2025-2034

Forecast Year

North America Visual Effects Market Outlook

The North America visual effects (VFX) market size was approximately USD 15.80 billion in 2024. The market is estimated to grow at a CAGR of 12.7% during 2025-2034 to reach a value of USD 46.16 billion by 2034.

News and Development in the Market

  • In September 2022, Disney filed a patent for its new innovation based on augmented reality technology. Designed for the park theme rides, it would allow people visiting the park to experience AR without wearing specific AR glasses. The company is pursuing several innovative technologies that involve augmented reality.
  • In July 2022, Company 3 brand Stereo D rebranded itself as SDFX studios completely changing into a business of visual effects. With its new name it will partner with VFX companies to create visual effects for feature films, commercials, and other platforms. It has partnered with brands such as Marvel Studios and ILM.
  • In June 2022, DNEG, a company leading in technology-enabled visual effects (VFX) and animation, and Sports Venture Acquisition Corporation (NASDAQ: AKIC) a publicly traded special purpose acquisition company decided to terminate their longstanding business agreement immediately. This was primarily attributed to unfavourable SPAC and equity market conditions.
  • In May 2022, DNEG, a leading visual effects and animation studio, officially started a new studio named Toronto Visual Effects and Animation in the King West district of Toronto with around 150 hired employees.  It continues to hire employees for this new studio and is considering expanding the studio further, based on demand from the clients for its premium animation and visual effect services, and has a strong position in the North America visual effects (VFX) market.
  • In January 2022, a visual effect powerhouse having seven production facilities across North America, Crafty Apes, announced that it acquired Molecule VFX, a developed visuals effect company based in New York and Los Angeles. These two companies together specialise in creative VFX supervision and production management.

north america visual effects market

Read more about this report - REQUEST FREE SAMPLE COPY IN PDF

Key Trends in the Market

Visual effects, also known as VFX is a method of combining a self-created image or any moving media that does not exist in real life with live action footage. The manipulated imagery is used to create environments that are either too dangerous to shoot in real-life or do not physically exist. There are three types of visual effects commonly used in the North America visual effects (VFX) market including CGI, compositing, and motion capture. The VFX companies provide with various design to the customers thus helping the film industry to create unrealistic movements.
  • Increase in demand for high quality video in filmmaking has surged the growth of the visual effect market. Directors are aiming at including innovative shots which are impossible to shoot in real life because of risk factors. This attracts audiences and thus helps in the surge of the North America visual effects market. Filmmakers are adopting VFX to tell their stories vividly and creatively.
  • Adoption of advanced technologies by creators is another key trend that is helping in the surge of the North America visual effects market. The use of cloud services to create content has helped in the production of high-quality scripted media thereby increasing the visual effects and animation requirements. These tools help creators to be quick, efficient, and productive to create more captivating effects than before.
  • The pandemic encouraged consumers to view shows through OTT platforms as a trending entertainment platform which helped in the growth of the viewership especially for animations for children. Accordingly, the animation industry increased the launch of new shows ultimately helping in the advancement of the VFX industry. The popularity of OTT is a major trend and helping in the upsurge of the North America visual effects market and animation market.
  • Improvements in VFX technology are making it difficult for the employees to keep up. The skillset required needs to be updated and courses in the market do not update their content time to time, creating a shortage of skilled individuals with relevant qualifications and requirements as the technology advances day to day. Challenges in keeping up with technology are affecting the North America visual effects market negatively.

Market Analysis

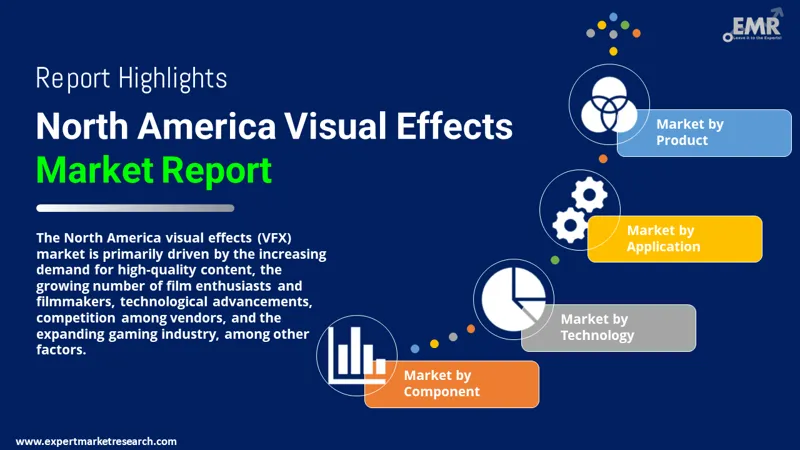
The North America visual effects market is segmented into hardware, software and services, based on component. Based on technology the market is divided into AI (artificial intelligence) and AR (augmented reality). On the basis of product, the market is divided into compositing, modelling, animation, matte paintings and others. Based on application it is divided into movies, television, gaming, advertisements, and others. By country the market is segmented into United States and Canada.

north america visual effects market by segments

Read more about this report - REQUEST FREE SAMPLE COPY IN PDF

The comprehensive EMR report provides an in-depth assessment of the North America visual effects (VFX) market based on Porter's five forces model along with giving a SWOT analysis. The report gives a detailed analysis of the following key players in the North America visual effects market, covering their competitive landscape and latest developments.

  • Animal Logic Group
  • Montreal International
  • Disney Enterprises Inc.
  • Framestore Limited
  • Sony Pictures Entertainment Inc.
  • Industrial Light & Magic 
  • Others

Market Share by Production Method

Artificial Intelligence is used for modelling and improvement in the animation of any character. This means, instead of creating a 3D model followed by animating the character’s face and then creating materials manually, it will study thousands of images of the actor that are real and the character the actor needs to be. Then the actor is transformed by mapping the features and providing the model. AI is capturing the imagination of filmmakers and VFX experts.

Market Share by Application

Based on application, movies have the largest share in the North America visual effects market followed by television. However, applications of VFX in advertisements are expected to grow in the forecast period. In movies, VFX is used to create objects, environments, and creatures that were not possible to shoot live or seemed impractical.

VFX in games is used to give a more enjoyable and surprising gaming experience and make the game look more professional, attracting more people to play. These games often have a story built-in that keeps the players engaged and gives them a realistic feeling. The gaming industry is continuously evolving, and regular updates are required. Advertisements videos that use a lot of animation or visual effect boost the marketing and help companies reach the target audience.

Therefore, VFX has a significant impact on audience management which helps in the upsurge of the North America visual effects market.

north america visual effects market by region

Read more about this report - REQUEST FREE SAMPLE COPY IN PDF

Competitive Landscape

  • Animal Logic Group founded in 1987 has its headquarters in Sydney, Australia. It has been world’s leading and award-winning visual effect and animation studio for over 30 years now. Its latest work including ALab and Unhinged, Peter Rabbit 2, The Lego Movie 2, Captain Marvel, and many others. It helps tell great stories, give breath-taking visuals, and memorable performances, implementing a perfect use of next level technology.
  • Disney Enterprises Inc. founded in 1996 is a division of the famous The Walt Disney Company, a multinational entertainment animation company widely known for the creation of its first animated popular character Mickey Mouse. Disney Enterprises Inc. focuses on television shows and movies aired on the Disney networks and those made by Disney. They also own all the trademarks and copyrights of the various Disney brands.
  • Sony Pictures Entertainment Inc. founded in 1987 is a multinational mass media and entertainment studio. They produce motion pictures and television programs through various platforms. They aim at providing entertainment and engaging billion of people in their content, helping the creators and the audience connect. They use their creativity and technology to fill the world with various emotions.

Other market players include Montreal International, Framestore Limited, Industrial Light and Magic, and others.

Key Highlights of the Report

REPORT FEATURES DETAILS
Base Year 2023
Historical Period 2018-2024
Forecast Period 2025-2034
Scope of the Report

Historical and Forecast Trends, Industry Drivers and Constraints, Historical and Forecast Market Analysis by Segment:

  • Component
  • Production Method
  • Application
  • Region
Breakup by Component
  • Hardware
  • Software
  • Services
Breakup by Production Method
  • Modelling
  • Matte paintings
  • Others
Breakup by Application
  • Movies
  • Television
  • Gaming
  • Advertisements
  • Others
Breakup by Region
  • United States
  • Canada
Market Dynamics
  • SWOT Analysis
  • Porter's Five Forces Analysis
  • Key Indicators for Demand
  • Key Indicators for Price
Competitive Landscape
  • Market Structure
  • Company Profiles
    • Company Overview
    • Product Portfolio
    • Demographic Reach and Achievements
    • Certifications
Companies Covered
  • Animal Logic Group
  • Montréal International
  • Disney Enterprises, Inc.
  • Framestore Limited
  • Sony Pictures Entertainment Inc.
  • Industrial Light & Magic
  • Others

North America Visual Effects Market Report Snapshots

North America Visual Effects Market Size

North America Visual Effects Market Share

North America Visual Effects Market Analysis

North America Visual Effects Companies

*While we strive to always give you current and accurate information, the numbers depicted on the website are indicative and may differ from the actual numbers in the main report. At Expert Market Research, we aim to bring you the latest insights and trends in the market. Using our analyses and forecasts, stakeholders can understand the market dynamics, navigate challenges, and capitalize on opportunities to make data-driven strategic decisions.*

Looking for specific insights?

Get in touch with us for a customized solution tailored to your unique requirements and save upto 35%!

Key Questions Answered in the Report

The is North America market for visual effects is expected to grow at a CAGR of 12.7% between 2025 and 2034.

The key drivers of the market are increasing demand for quality content, increasing number of film enthusiasts and filmmakers, technological advancements, competition among vendors, and the growing gaming industry, among other factors.

Key market trends include demand for high quality videos, advanced technologies, animation industry, shortage of skilled employees and others.

Visual effect abbreviated as VFX is a method of combining a self-created image or any moving media that does not exist in real life with live action footage.

There are three types of visual effects including CGI, compositing, and motion capture.

The North America visual effects (VFX) market is segmented based on component, technology, product, application, and country.

Key players in the market are Industrial Light and Magic, Sony Pictures Entertainment Inc., Framestore Limited, Disney Enterprises Inc., Montréal International, Animal Logic Group, and others.

Based on production method, the market is segmented into modelling, matte paintings, and others.

Artificial Intelligence studies thousands of real images of an actor and the character the actor needs to be transformed into and then maps the features, providing the model.

AR can connect to any device with camera equipped in it and provide real time data flowing from products that can be controlled by voice, touch, or gesture.

Datasheet

10% OFF

USD

2,199

1,999

Single User License

10% OFF

USD

3,299

2,999

Five User License

10% OFF

USD

4,399

3,999

Corporate License

10% OFF

USD

5,499

4,999

Datasheet


USD 2,199

USD 1,999

tax inclusive*

  • Selected Sections, One User
  • Printing Not Allowed
  • Email Delivery in PDF
  • Free Limited Customisation
  • Post Sales Analyst Support
  • 50% Discount on Next Update

Single User License

One User

USD 3,299

USD 2,999

tax inclusive*

  • All Sections, One User
  • One Print Allowed
  • Email Delivery in PDF
  • Free Limited Customisation
  • Post Sales Analyst Support
  • 50% Discount on Next Update

Five User License

Five Users

USD 4,399

USD 3,999

tax inclusive*

  • All Sections, Five Users
  • Five Prints Allowed
  • Email Delivery in PDF
  • Free Limited Customisation
  • Post Sales Analyst Support
  • 50% Discount on Next Update

Corporate License

Unlimited Users

USD 5,499

USD 4,999

tax inclusive*

  • All Sections, Unlimited Users
  • Unlimited Prints Allowed
  • Email Delivery in PDF + Excel
  • Free Limited Customisation
  • Post Sales Analyst Support
  • 50% Discount on Next Update

*Please note that the prices mentioned below are starting prices for each bundle type. Kindly contact our team for further details.*

Bundle Type

Flash Bundle

20% OFF Number of Reports: 3

Small Business Bundle

25% OFF Number of Reports: 5

Growth Bundle

30% OFF Number of Reports: 8

Enterprise Bundle

35% OFF Number of Reports: 10
Overview
  • Life Time Access
  • Analyst Support Related to Report
  • PDF Version of the Report
  • Complimentary Excel Data Set
  • Free Analyst Hours
  • Complimentary Free 1 Month Subscription to Trade Data Base
  • Complimentary One Month Subscription to Price Database (Chemicals only)
  • Complementary PPT Version of the Report
  • Complimentary License Upgrade
  • Complimentary Power BI Dashboards
  • Life Time Access
  • Analyst Support Related to Report
  • PDF Version of the Report
  • Complimentary Excel Data Set
  • Free Analyst Hours - 50 Hours
  • Complimentary Free 1 Month Subscription to Trade Data Base
  • Complimentary One Month Subscription to Price Database (Chemicals only)
  • Complementary PPT Version of the Report
  • Complimentary License Upgrade
  • Complimentary Power BI Dashboards
  • Life Time Access
  • Analyst Support Related to Report
  • PDF Version of the Report
  • Complimentary Excel Data Set
  • Free Analyst Hours - 80 Hours
  • Complimentary Free 1 Month Subscription to Trade Data Base
  • Complimentary One Month Subscription to Price Database (Chemicals only)
  • Complementary PPT Version of the Report
  • Complimentary License Upgrade
  • Complimentary Power BI Dashboards
  • Life Time Access
  • Analyst Support Related to Report
  • PDF Version of the Report
  • Complimentary Excel Data Set
  • Free Analyst Hours - 100 Hours
  • Complimentary Free 1 Month Subscription to Trade Data Base
  • Complimentary One Month Subscription to Price Database (Chemicals only)
  • Complementary PPT Version of the Report
  • Complimentary License Upgrade
  • Complimentary Power BI Dashboards

*Please note that the prices mentioned below are starting prices for each bundle type. Kindly contact our team for further details.*

Flash Bundle

Number of Reports: 3

20%

tax inclusive*

  • 3 Reports Included
  • Life Time Acess
  • Analyst Support Related to Report
  • PDF Version of the Report
  • Free 1 Month Subscription to Trade Data Base
  • 1 Month Subscription to Price Database (Chemicals only)
  • Complimentary Excel Data Set
  • PPT Version of the Report
  • Power BI Dashboards
  • License Upgrade
  • Free Analyst Hours

Small Business Bundle

Number of Reports: 5

25%

tax inclusive*

  • 5 Reports Included
  • Life Time Acess
  • Analyst Support Related to Report
  • PDF Version of the Report
  • Complimentary Excel Data Set
  • Free Analyst Hours - 50 Hours
  • Free 1 Month Subscription to Trade Data Base
  • 1 Month Subscription to Price Database (Chemicals only)
  • Complimentary Excel Data Set
  • PPT Version of the Report
  • Power BI Dashboards
  • License Upgrade

Growth Bundle

Number of Reports: 8

30%

tax inclusive*

  • 8 Reports Included
  • Life Time Acess
  • Analyst Support Related to Report
  • PDF Version of the Report
  • Complimentary Excel Data Set
  • Free Analyst Hours - 50 Hours
  • Free 1 Month Subscription to Trade Data Base
  • 1 Month Subscription to Price Database (Chemicals only)
  • License Upgrade
  • Free Analyst Hours - 80 Hours
  • Power BI Dashboards

Enterprise Bundle

Number of Reports: 10

35%

tax inclusive*

  • 10 Reports Included
  • Life Time Acess
  • Analyst Support Related to Report
  • PDF Version of the Report
  • Complimentary Excel Data Set
  • Free Analyst Hours - 50 Hours
  • Free 1 Month Subscription to Trade Data Base
  • 1 Month Subscription to Price Database (Chemicals only)
  • License Upgrade
  • Power BI Dashboards
  • Free Analyst Hours - 100 Hours

How To Order

Our step-by-step guide will help you select, purchase, and access your reports swiftly, ensuring you get the information that drives your decisions, right when you need it.

Select License Type

Choose the right license for your needs and access rights.

Click on ‘Buy Now’

Add the report to your cart with one click and proceed to register.

Select Mode of Payment

Choose a payment option for a secure checkout. You will be redirected accordingly.

Strategic Solutions for Informed Decision-Making

Connect For More Information

Our expert team of analysts will offer full support and resolve any queries regarding the report, before and after the purchase.

Our expert team of analysts will offer full support and resolve any queries regarding the report, before and after the purchase.

We employ meticulous research methods, blending advanced analytics and expert insights to deliver accurate, actionable industry intelligence, staying ahead of competitors.

Our skilled analysts offer unparalleled competitive advantage with detailed insights on current and emerging markets, ensuring your strategic edge.

We offer an in-depth yet simplified presentation of industry insights and analysis to meet your specific requirements effectively.

We’re here to help answer any questions about our products and services.

Contact us

Our Offices


Australia

63 Fiona Drive, Tamworth, NSW

+61-448-061-727

India

C130 Sector 2 Noida, Uttar Pradesh 201301

+91-858-608-1494

Philippines

40th Floor, PBCom Tower, 6795 Ayala Avenue Cor V.A Rufino St. Makati City,1226.

+63-287-899-028, +63-967-048-3306

United Kingdom

6 Gardner Place, Becketts Close, Feltham TW14 0BX, Greater London

+44-753-713-2163

United States

30 North Gould Street, Sheridan, WY 82801

+1-415-325-5166

Vietnam

193/26/4 St.no.6, Ward Binh Hung Hoa, Binh Tan District, Ho Chi Minh City

+84-865-399-124

30 North Gould Street, Sheridan, WY 82801

+1-415-325-5166

63 Fiona Drive, Tamworth, NSW

+61-448-061-727

C130 Sector 2 Noida, Uttar Pradesh 201301

+91-858-608-1494

40th Floor, PBCom Tower, 6795 Ayala Avenue Cor V.A Rufino St. Makati City, 1226.

+63-287-899-028, +63-967-048-3306

6 Gardner Place, Becketts Close, Feltham TW14 0BX, Greater London

+44-753-713-2163

193/26/4 St.no.6, Ward Binh Hung Hoa, Binh Tan District, Ho Chi Minh City

+84-865-399-124