

Consumer Insights
Uncover trends and behaviors shaping consumer choices today
Procurement Insights
Optimize your sourcing strategy with key market data
Industry Stats
Stay ahead with the latest trends and market analysis.
Trending Now


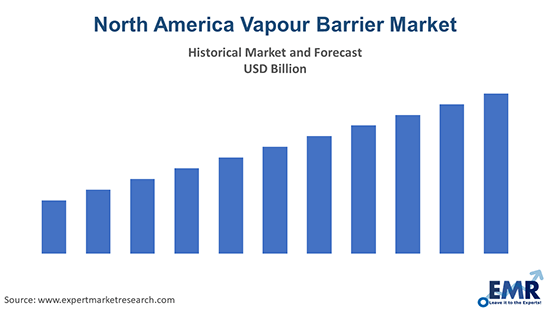
The North America vapour barrier market size attained a value of USD 1901.17 million in 2024. The market is expected to grow at a CAGR of 3.5% in the forecast period of 2025-2034 to reach a value of USD 2591.10 million by 2034.
Base Year
Historical Year
Forecast Year


Read more about this report - REQUEST FREE SAMPLE COPY IN PDF
The global weather barrier industry attained a value of USD 4.2 billion in 2018, aided by the growth of the North America vapour barrier market. North America weather resistant barrier industry accounts for nearly 23% of the total share in the industry, globally. During the 2025-2034, the North America weather barrier market is expected to grow at a CAGR of 3.1%.
The growth of the construction industry in North America led by the expansion of buildings in residential and commercial sectors is the key driver for the growth of the vapour barrier industry in the region. As of 2020, the North America construction industry stood at a value of around USD 2 trillion. Also, increased government spending on public infrastructure is aiding the industry further. Within North America, the majority of the house wrap and weather resistant barrier (WRB) find their application in new homes in the US, that is, about 60% of house wrap along with WRB material is installed on new homes while the remainder is installed primarily on homes being resided.
“Vapour Barrier Market Report and Forecast 2024-2032” offers a detailed analysis of the market based on the following segments:
Market Breakup by Membrane Type
Market Breakup by Application
Market Breakup by End Use
Market Breakup by Region
Read more about this report - REQUEST FREE SAMPLE COPY IN PDF
The industry is being driven by the increased demand for vapour barriers, globally, to prevent the damage caused by the moisture to the buildings or other structures. Further, the rising construction activities in the region is also aiding the industry. The growth in the construction industry in North America is led by the expansion of buildings in the residential and commercial sectors. The rising urbanisation and growing population have increased the demand for residential structures in the region, providing a boost to the industry. The increasing disposable incomes has resulted in the demand for more comfortable and luxurious structures. Moisture infiltration can shorten lifespan of paints and stains, causing exterior surfaces to deteriorate, thus, the use of weather resistant barriers, like vapour and air barrier, has increased rapidly in the recent times. Also, the government spending on public infrastructure in the region has increased, thus, propelling the industry forward.
Moreover, the increasing awareness among people regarding the various health hazards is further aiding the industry growth. Increased moisture infiltration fosters mould and rot, which can cause serious health hazards to the people living in such environment, therefore, increasing the demand for vapour barriers in buildings and other structures. Further, buildings account for nearly 41% of the energy demand and 39% of carbon dioxide emissions, according to the US Department of Energy. With the advances in building science, combined with new and evolving codes, the use of insulation in the exterior walls to increase energy efficiency has increased, leading to the use of vapour barriers or air barriers to prevent condensation within the wall assemblies, and therefore, providing further impetus to the industry.
The report gives a detailed analysis of the following key players in the vapour barrier market in North America, covering their competitive landscape, capacity, and latest developments like mergers, acquisitions, and investments, expansions of capacity, and plant turnarounds:
The comprehensive EMR report provides an in-depth assessment of the market based on the Porter's five forces model along with giving a SWOT analysis.
*While we strive to always give you current and accurate information, the numbers depicted on the website are indicative and may differ from the actual numbers in the main report. At Expert Market Research, we aim to bring you the latest insights and trends in the market. Using our analyses and forecasts, stakeholders can understand the market dynamics, navigate challenges, and capitalize on opportunities to make data-driven strategic decisions.*
Get in touch with us for a customized solution tailored to your unique requirements and save upto 35%!
The North America vapour barrier market attained a value of nearly USD 1901.17 million in 2024.
The market is projected to grow at a CAGR of 3.5% between 2025 and 2034.
The major drivers of the market include rising disposable incomes, increasing population, and the expansion of buildings in residential and commercial sectors.
The growing demand for vapour barriers in buildings and other structures and rising concerns regarding moisture infiltration are the key trends guiding the North America market.
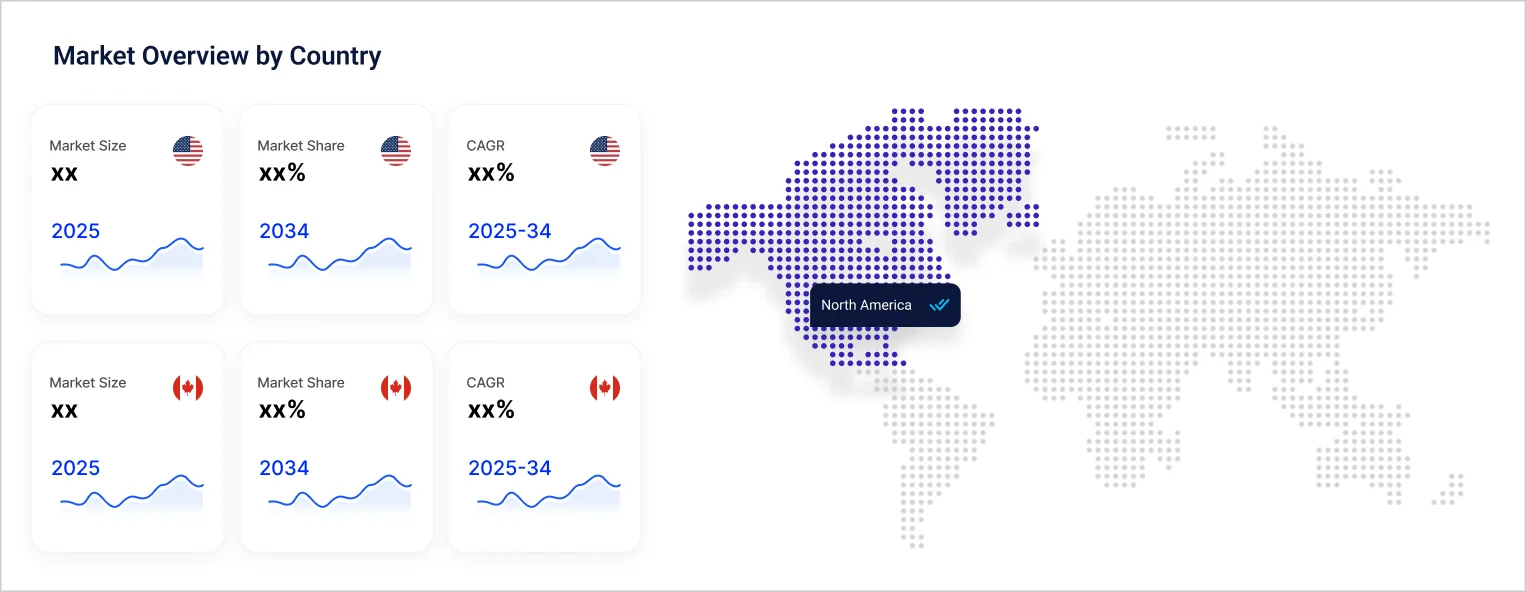
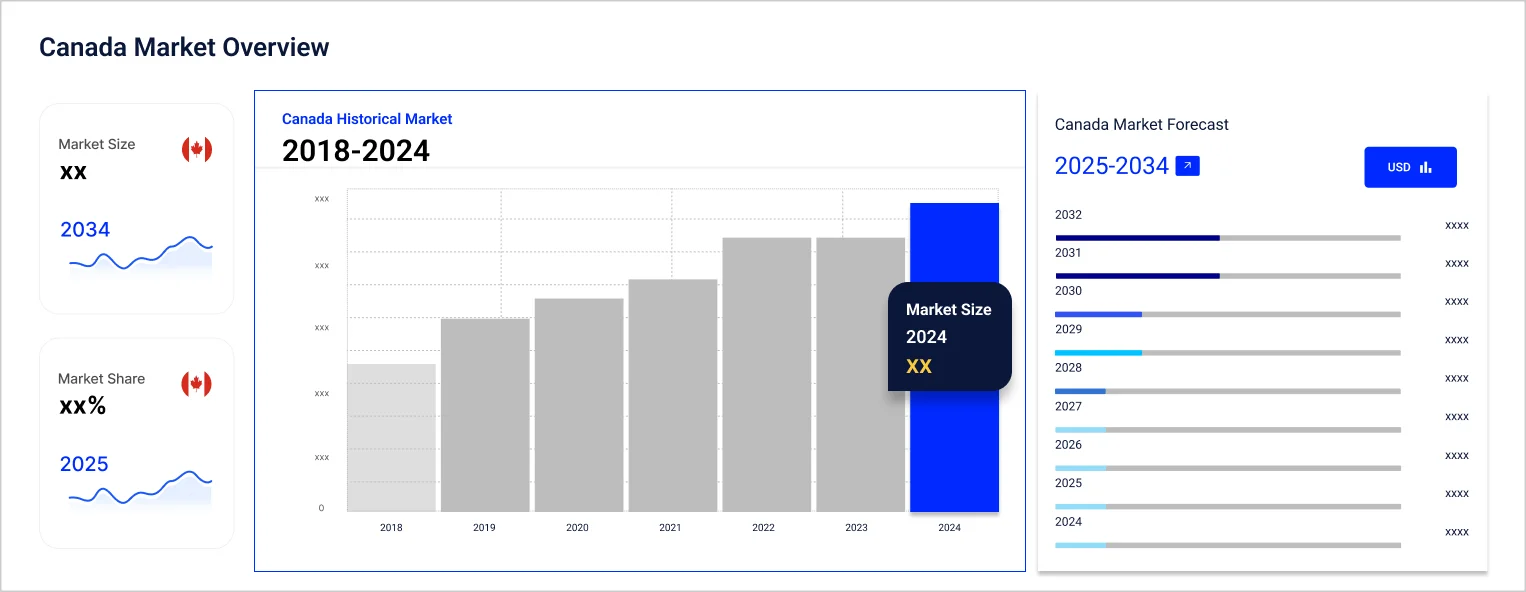
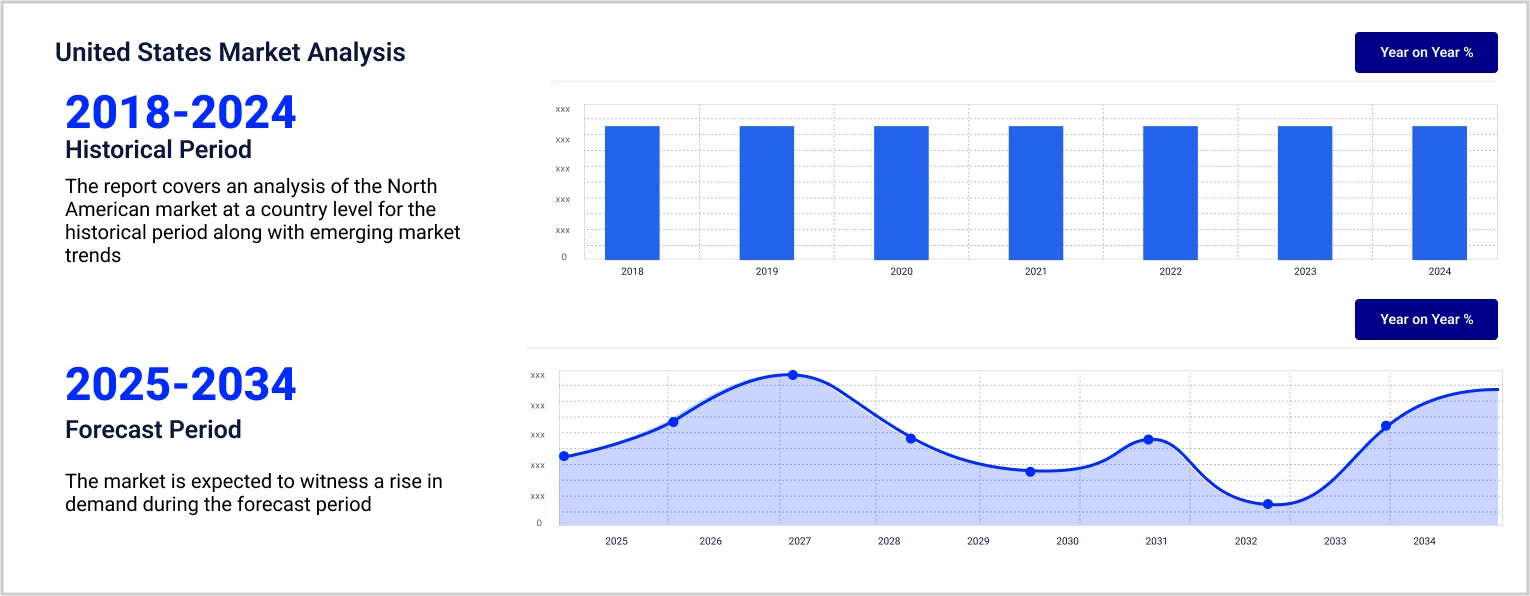
The United States of America and Canada are the major countries for vapour barrier.
The major membrane types include sheet applied and fluid applied.
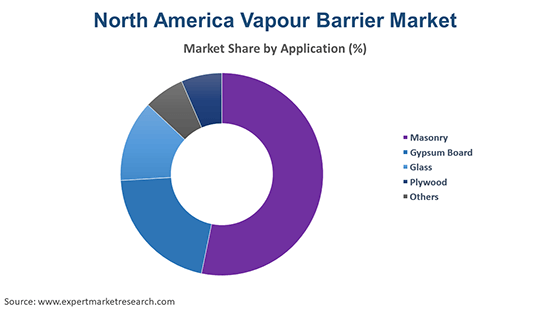
The significant applications of vapour barrier are masonry, gypsum board, glass, and plywood, among others.
Residential, commercial, and public infrastructure are the various end uses of vapour barrier.
The major market players are RPM International Inc., BASF SE, DuPont de Nemours, Inc., WR Meadows, Inc., Carlisle Companies Inc., Mark Beamish Waterproofing, SOPREMA, Inc., Henry Company, Dryspace, Inc, and 3M, among others.
Explore our key highlights of the report and gain a concise overview of key findings, trends, and actionable insights that will empower your strategic decisions.
| REPORT FEATURES | DETAILS |
| Base Year | 2024 |
| Historical Period | 2018-2024 |
| Forecast Period | 2025-2034 |
| Scope of the Report |
Historical and Forecast Trends, Industry Drivers and Constraints, Historical and Forecast Market Analysis by Segment:
|
| Breakup by Membrane Type |
|
| Breakup by Application |
|
| Breakup by End Use |
|
| Breakup by Region |
|
| Market Dynamics |
|
| Competitive Landscape |
|
| Companies Covered |
|
| Report Price and Purchase Option | Explore our purchase options that are best suited to your resources and industry needs. |
| Delivery Format | Delivered as an attached PDF and Excel through email, with an option of receiving an editable PPT, according to the purchase option. |
Datasheet
One User
USD 2,999
USD 2,699
tax inclusive*
Single User License
One User
USD 4,399
USD 3,959
tax inclusive*
Five User License
Five User
USD 5,599
USD 4,759
tax inclusive*
Corporate License
Unlimited Users
USD 6,659
USD 5,660
tax inclusive*
*Please note that the prices mentioned below are starting prices for each bundle type. Kindly contact our team for further details.*
Flash Bundle
Small Business Bundle
Growth Bundle
Enterprise Bundle
*Please note that the prices mentioned below are starting prices for each bundle type. Kindly contact our team for further details.*
Flash Bundle
Number of Reports: 3
20%
tax inclusive*
Small Business Bundle
Number of Reports: 5
25%
tax inclusive*
Growth Bundle
Number of Reports: 8
30%
tax inclusive*
Enterprise Bundle
Number of Reports: 10
35%
tax inclusive*
How To Order
Our step-by-step guide will help you select, purchase, and access your reports swiftly, ensuring you get the information that drives your decisions, right when you need it.

Select License Type
Choose the right license for your needs and access rights.

Click on ‘Buy Now’
Add the report to your cart with one click and proceed to register.

Select Mode of Payment
Choose a payment option for a secure checkout. You will be redirected accordingly.
Track prices with detailed trend reports.

Analyse trade data for supply chain insights.

Leverage cost reports for smart savings

Enhance supply chain with partnerships.

Gain insights to stay ahead and seize opportunities.

Get insights & trends for a competitive edge.

Track prices with detailed trend reports.
Analyse trade data for supply chain insights.
Leverage cost reports for smart savings
Enhance supply chain with partnerships.
Gain insights to stay ahead and seize opportunities.
Get insights & trends for a competitive edge.
Track prices with detailed trend reports.
Analyse trade data for supply chain insights.
Connect For More Information
Our expert team of analysts will offer full support and resolve any queries regarding the report, before and after the purchase.
Our expert team of analysts will offer full support and resolve any queries regarding the report, before and after the purchase.
We employ meticulous research methods, blending advanced analytics and expert insights to deliver accurate, actionable industry intelligence, staying ahead of competitors.
Our skilled analysts offer unparalleled competitive advantage with detailed insights on current and emerging markets, ensuring your strategic edge.
We offer an in-depth yet simplified presentation of industry insights and analysis to meet your specific requirements effectively.
Australia
63 Fiona Drive, Tamworth, NSW
+61-448-061-727
India
C130 Sector 2 Noida, Uttar Pradesh 201301
+91-723-689-1189
Philippines
40th Floor, PBCom Tower, 6795 Ayala Avenue Cor V.A Rufino St. Makati City,1226.
+63-287-899-028, +63-967-048-3306
United Kingdom
6 Gardner Place, Becketts Close, Feltham TW14 0BX, Greater London
+44-753-713-2163
United States
30 North Gould Street, Sheridan, WY 82801
+1-415-325-5166
Vietnam
193/26/4 St.no.6, Ward Binh Hung Hoa, Binh Tan District, Ho Chi Minh City
+84-865-399-124
United States (Head Office)
30 North Gould Street, Sheridan, WY 82801
+1-415-325-5166
Australia
63 Fiona Drive, Tamworth, NSW
+61-448-061-727
India
C130 Sector 2 Noida, Uttar Pradesh 201301
+91-723-689-1189
Philippines
40th Floor, PBCom Tower, 6795 Ayala Avenue Cor V.A Rufino St. Makati City, 1226.
+63-287-899-028, +63-967-048-3306
United Kingdom
6 Gardner Place, Becketts Close, Feltham TW14 0BX, Greater London
+44-753-713-2163
Vietnam
193/26/4 St.no.6, Ward Binh Hung Hoa, Binh Tan District, Ho Chi Minh City
+84-865-399-124


Share