

Consumer Insights
Uncover trends and behaviors shaping consumer choices today
Procurement Insights
Optimize your sourcing strategy with key market data
Industry Stats
Stay ahead with the latest trends and market analysis.
Trending Now


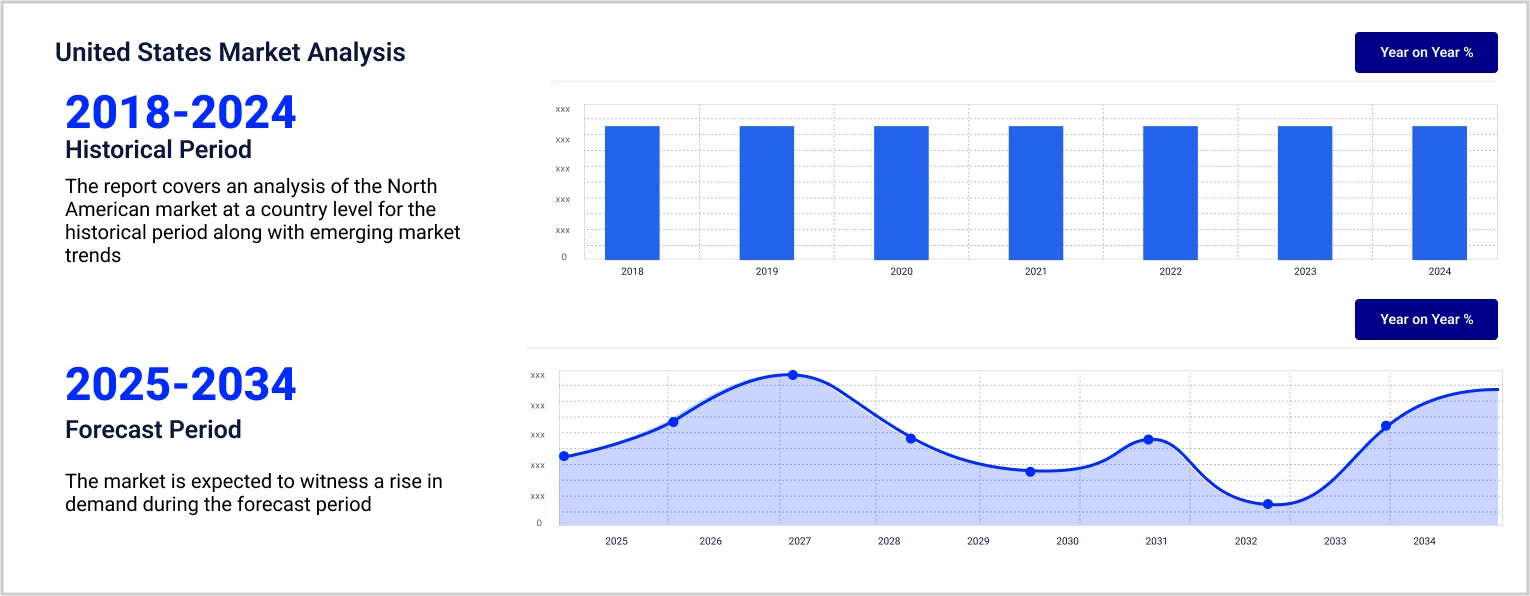
The North America salt market reached USD 5.78 Billion in 2024. The market is projected to grow at a CAGR of 5.10% between 2025 and 2034, reaching almost USD 9.51 Billion by 2034.
Base Year
Historical Year
Forecast Year
The average salt consumption of an American adult is 3,300 mg.
The average salt consumed by a Canadian person daily is 2,760mg.
Salt finds extensive applications in road de-icing processes during the winter season.


Value in USD Billion
2025-2034
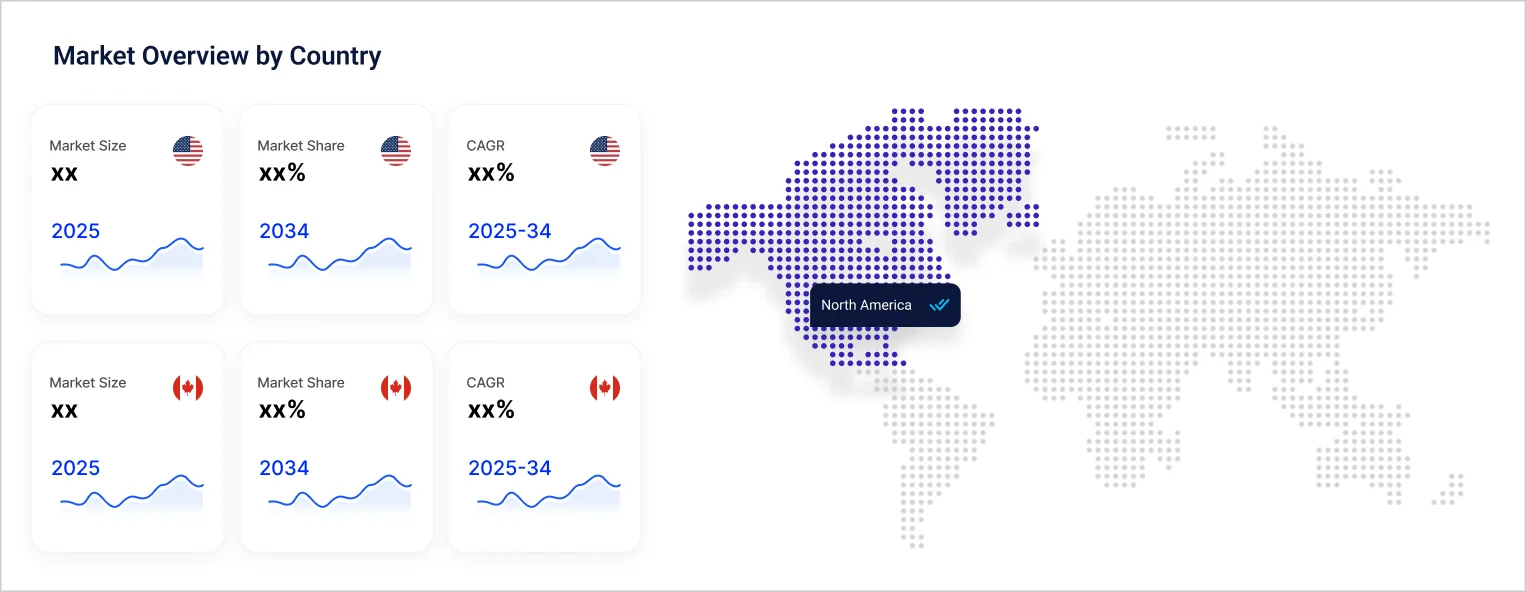
North America Salt Market Outlook
*this image is indicative*
| North America Salt Market Summary | Description | Value |
| Base Year | USD Billion | 2024 |
| Historical Period | USD Billion | 2018-2024 |
| Forecast Period | USD Billion | 2025-2034 |
| Market Size 2024 | USD Billion | 5.78 |
| Market Size 2034 | USD Billion | 9.51 |
| CAGR 2018-2024 | Percentage | XX% |
| CAGR 2025-2034 | Percentage | 5.10% |
| CAGR 2025-2034 - Market by Country | Canada | 5.6% |
| CAGR 2025-2034 - Market by Type | Brine | 5.4% |
| CAGR 2025-2034 - Market by Application | Food Processing | 5.8% |
| 2024 Market Share by Country | Canada | 12.7% |
The United States manufactures inorganic and organic chemicals, sealants, and plastic resins, among other chemicals, for the agricultural and consumer goods sector. In 2019, the United States exported chemicals worth over $208 billion, which constituted 15% of the global supply. Its domestic industry (having 13,000 firms) produces over 70,000 chemical products annually. Globally, the increasing demand for speciality chemicals is expected to necessitate the use of salt by the domestic chemical industry, which is a key component for manufacturing chlorine, sodium bicarbonate, and other chemicals.
The United States is the world’s biggest nuclear power producer, which constitutes a 30% share of the global nuclear power production. In 2022 , the US produced 772 TWh of electricity from its nuclear power plants, which constituted 18% of the overall electricity output. With the introduction of the Inflation Reduction Act, the government is incentivising the expansion of existing nuclear power facilities through tax breaks and subsidies. Molten salt reactors are expected to play a key role in driving this expansion, as they have excellent heat absorption capacity and can fuel the process of nuclear power and green hydrogen production. They have the benefit of minimising waste generation while enhancing the safety of the production process.
North America Salt Market Report and Forecast 2025-2034 offers a detailed analysis of the market based on the following segments:
Market Breakup by Type
Market Breakup by Application
Market Breakup by Country
| CAGR 2025-2034 - Market by | Type |
| Brine | 5.4% |
| Vacuum Salt | 4.7% |
| Rock Salt | XX% |
| Solar Salt | XX% |
| CAGR 2025-2034 - Market by | Application |
| Food Processing | 5.8% |
| De-Icing | 4.7% |
| Chemical Processing | XX% |
| Others | XX% |
| CAGR 2025-2034 - Market by | Country |
| Canada | 5.6% |
| United States of America | XX% |
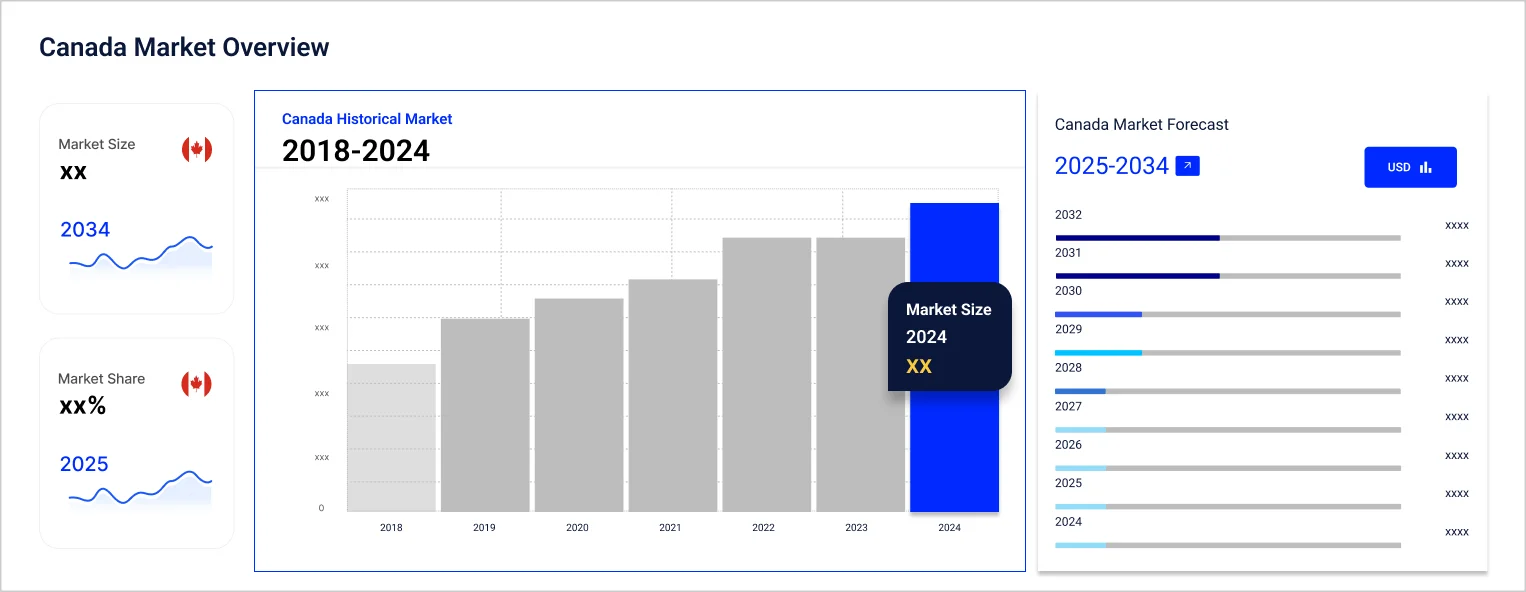
Based on country, the market is divided into the United States of America and Canada. Over the forecast period of 2025-2034, Canada is projected to grow at a CAGR of 5.6% amid the growing export of salt and the expansion of fast food chains.
| 2024 Market Share by | Country |
| United States of America | XX% |
| Canada | 12.7% |
Major market players are expected to use salt for manufacturing and storing renewable energy. The increasing use of salt in the pharmaceutical, and oil and gas industry is also expected to drive the market growth.
*While we strive to always give you current and accurate information, the numbers depicted on the website are indicative and may differ from the actual numbers in the main report. At Expert Market Research, we aim to bring you the latest insights and trends in the market. Using our analyses and forecasts, stakeholders can understand the market dynamics, navigate challenges, and capitalize on opportunities to make data-driven strategic decisions.*
Get in touch with us for a customized solution tailored to your unique requirements and save upto 35%!
The market was valued at nearly USD 5.78 Billion in 2024.
The market is projected to grow at a CAGR of 5.10% between 2025 and 2034.
The market is assessed to witness a healthy growth in the forecast period to reach around USD 9.51 Billion in 2034.
The different types of salt in the market include rock salt, brine, solar salt, and vacuum salt.
The different applications of salt include chemical processing, de-icing, and food processing, among others.
The different regions covered in the market report are the United States of America and Canada.
The key market players are American Rock Salt, Cargill Incorporated, Compass Minerals International, Inc., K+S Aktiengesellschaft, Morton Salt, Inc., US Salt LLC, Jacobsen LLC, Ahir Salt Industries, INEOS Group, and Amagansett Sea Salt Co., among others.
Explore our key highlights of the report and gain a concise overview of key findings, trends, and actionable insights that will empower your strategic decisions.
| REPORT FEATURES | DETAILS |
| Base Year | 2024 |
| Historical Period | 2018-2024 |
| Forecast Period | 2025-2034 |
| Scope of the Report |
Historical and Forecast Trends, Industry Drivers and Constraints, Historical and Forecast Market Analysis by Segment:
|
| Breakup by Type |
|
| Breakup by Application |
|
| Breakup by Region |
|
| Market Dynamics |
|
| Competitive Landscape |
|
| Companies Covered |
|
Datasheet
One User
USD 2,499
USD 2,249
tax inclusive*
Single User License
One User
USD 3,999
USD 3,599
tax inclusive*
Five User License
Five User
USD 4,999
USD 4,249
tax inclusive*
Corporate License
Unlimited Users
USD 5,999
USD 5,099
tax inclusive*
*Please note that the prices mentioned below are starting prices for each bundle type. Kindly contact our team for further details.*
Flash Bundle
Small Business Bundle
Growth Bundle
Enterprise Bundle
*Please note that the prices mentioned below are starting prices for each bundle type. Kindly contact our team for further details.*
Flash Bundle
Number of Reports: 3
20%
tax inclusive*
Small Business Bundle
Number of Reports: 5
25%
tax inclusive*
Growth Bundle
Number of Reports: 8
30%
tax inclusive*
Enterprise Bundle
Number of Reports: 10
35%
tax inclusive*
How To Order
Our step-by-step guide will help you select, purchase, and access your reports swiftly, ensuring you get the information that drives your decisions, right when you need it.

Select License Type
Choose the right license for your needs and access rights.

Click on ‘Buy Now’
Add the report to your cart with one click and proceed to register.

Select Mode of Payment
Choose a payment option for a secure checkout. You will be redirected accordingly.
Gain insights to stay ahead and seize opportunities.

Get insights & trends for a competitive edge.

Track prices with detailed trend reports.

Analyse trade data for supply chain insights.

Leverage cost reports for smart savings

Enhance supply chain with partnerships.

Connect For More Information
Our expert team of analysts will offer full support and resolve any queries regarding the report, before and after the purchase.
Our expert team of analysts will offer full support and resolve any queries regarding the report, before and after the purchase.
We employ meticulous research methods, blending advanced analytics and expert insights to deliver accurate, actionable industry intelligence, staying ahead of competitors.
Our skilled analysts offer unparalleled competitive advantage with detailed insights on current and emerging markets, ensuring your strategic edge.
We offer an in-depth yet simplified presentation of industry insights and analysis to meet your specific requirements effectively.
Australia
63 Fiona Drive, Tamworth, NSW
+61-448-061-727
India
C130 Sector 2 Noida, Uttar Pradesh 201301
+91-723-689-1189
Philippines
40th Floor, PBCom Tower, 6795 Ayala Avenue Cor V.A Rufino St. Makati City,1226.
+63-287-899-028, +63-967-048-3306
United Kingdom
6 Gardner Place, Becketts Close, Feltham TW14 0BX, Greater London
+44-753-713-2163
United States
30 North Gould Street, Sheridan, WY 82801
+1-415-325-5166
Vietnam
193/26/4 St.no.6, Ward Binh Hung Hoa, Binh Tan District, Ho Chi Minh City
+84-865-399-124
United States (Head Office)
30 North Gould Street, Sheridan, WY 82801
+1-415-325-5166
Australia
63 Fiona Drive, Tamworth, NSW
+61-448-061-727
India
C130 Sector 2 Noida, Uttar Pradesh 201301
+91-723-689-1189
Philippines
40th Floor, PBCom Tower, 6795 Ayala Avenue Cor V.A Rufino St. Makati City, 1226.
+63-287-899-028, +63-967-048-3306
United Kingdom
6 Gardner Place, Becketts Close, Feltham TW14 0BX, Greater London
+44-753-713-2163
Vietnam
193/26/4 St.no.6, Ward Binh Hung Hoa, Binh Tan District, Ho Chi Minh City
+84-865-399-124


Share