

Consumer Insights
Uncover trends and behaviors shaping consumer choices today
Procurement Insights
Optimize your sourcing strategy with key market data
Industry Stats
Stay ahead with the latest trends and market analysis.

The North America real estate market reached around USD 4.00 Trillion in 2025. The market is projected to grow at a CAGR of 2.60% between 2026 and 2035, reaching almost USD 5.17 Trillion by 2035.
Base Year
Historical Period
Forecast Period
In 2022, the United States boasted nearly 125.7 million units of occupied houses.
The typical size of a house in the United States is 1900 square feet.
The United States has almost 5.9 million commercial buildings that occupy a total area of 97 billion square feet.
Compound Annual Growth Rate
2.6%
Value in USD Trillion
2026-2035
*this image is indicative*
| North America Real Estate Market Report Summary | Description | Value |
| Base Year | USD Trillion | 2025 |
| Historical Period | USD Trillion | 2019-2025 |
| Forecast Period | USD Trillion | 2026-2035 |
| Market Size 2025 | USD Trillion | 4.00 |
| Market Size 2035 | USD Trillion | 5.17 |
| CAGR 2019-2025 | Percentage | XX% |
| CAGR 2026-2035 | Percentage | 2.60% |
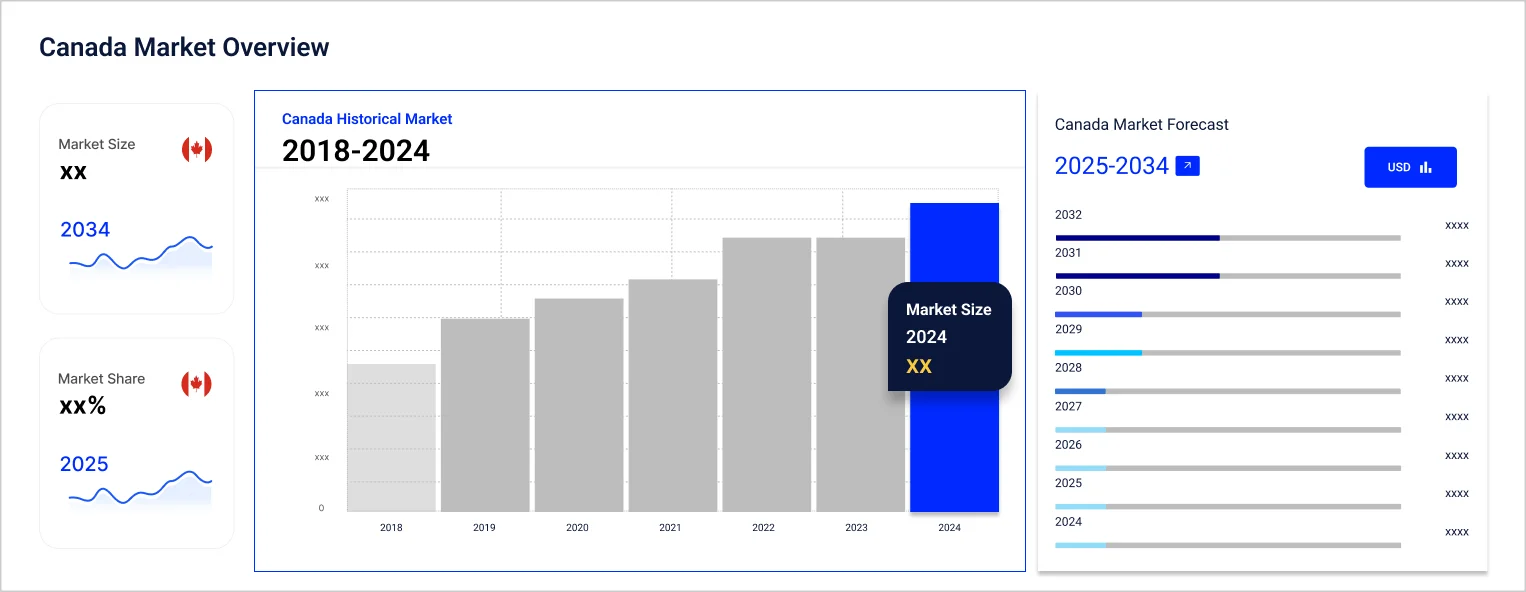
| CAGR 2026-2035 - Market by Country | Canada | 3.2% |
| CAGR 2026-2035 - Market by Type | Rental | 3.2% |
| CAGR 2026-2035 - Market by Property | Residential | 2.9% |
| 2025 Market Share by Country | Canada | 11.7% |
The process of adapting an existing structure for another use has become one of the key trends in the market. Globally, buildings account for 58% of overall carbon emissions, and adaptive reuses can result in significant savings (40%-70%) as compared to new construction projects.
In 2023, adaptive reuse deliveries recorded a year-on-year growth of 17.6%, reaching 12713. The conversion of 4,556 hotels and 3,587 offices into apartments has made the development of new housing spaces increasingly cost-effective, sustainable, and fast. Manhattan accounted for a major portion of such deliveries at 733 units, followed by Richmond (Virginia) and Alameda (California) at 662 and 372 units, respectively.
Factory-to-apartment conversions constitute 15% of all deliveries across the United States, witnessing a year-on-year growth of 31.6% and reaching 1954 units. Ongoing adaptive reuse projects have witnessed a year-on-year growth of 24%, with offices (58,000) and hospitality (34,000) constituting a huge share of the conversion pipeline.
The Inflation Reduction Act in the United States is expected to increase the volume of investments in the development of sustainable commercial and industrial projects over the forecast period. Moreover, an increasing number of multifamily housing complexes in Canada are seeking to balance their budgets with sustainable housing solutions, which is expected to drive the market growth.
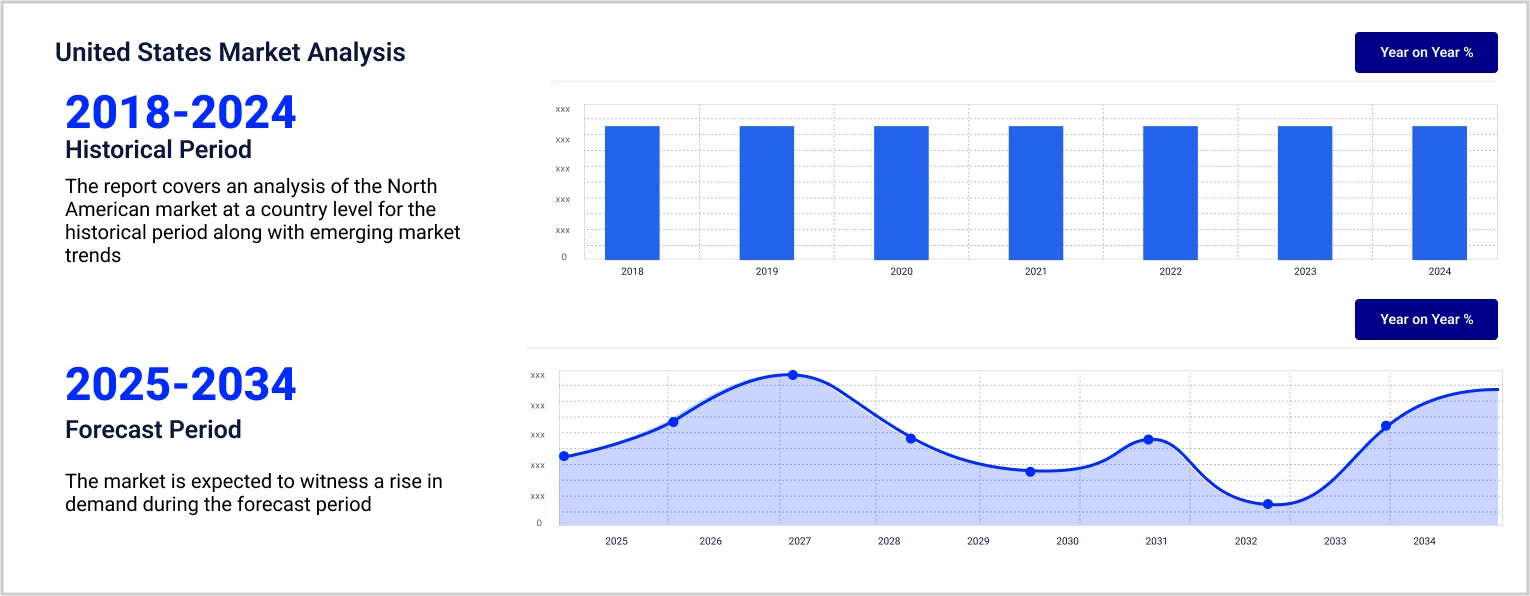
North America Real Estate Market Report and Forecast 2026-2035 offers a detailed analysis of the market based on the following segments:
Market Breakup by Type
Market Breakup by Property
Market Breakup by Mode
Market Breakup by Country
| CAGR 2026-2035 - Market by | Type |
| Rental | 3.2% |
| Lease | 2.4% |
| Sales | XX% |
| Others | XX% |
| CAGR 2026-2035 - Market by | Property |
| Residential | 2.9% |
| Land | 2.3% |
| Commercial | XX% |
| Industrial | XX% |
| CAGR 2026-2035 - Market by | Country |
| Canada | 3.2% |
| United States of America | XX% |
Based on property, the market is divided into residential, commercial, industrial, and land. Over the forecast period of 2026-2035, residential properties are projected to grow at a CAGR of 2.9% as the economies of Canada and the United States witness steady growth.
| 2025 Market Share by | Country |
| United States of America | XX% |
| Canada | 11.7% |
Major market players are expected to integrate sustainable building practices into the construction of various properties.


Upto 15% Off
USD
$2499 $2249
$3999 $3599
$4999 $4249
$5999 $5099


*While we strive to always give you current and accurate information, the numbers depicted on the website are indicative and may differ from the actual numbers in the main report. At Expert Market Research, we aim to bring you the latest insights and trends in the market. Using our analyses and forecasts, stakeholders can understand the market dynamics, navigate challenges, and capitalize on opportunities to make data-driven strategic decisions.*
Get in touch with us for a customized solution tailored to your unique requirements and save upto 35%!
The market reached nearly USD 4.00 Trillion in 2025.
The market is projected to grow at a CAGR of 2.60% between 2026 and 2035.
The market is assessed to witness a healthy growth in the forecast period to reach around USD 5.17 Trillion in 2035.
The major real estate types considered in the market report include sales, rental, and lease.
The major properties included in real estate are residential, commercial, industrial, and land, among others.
The different segments based on the mode considered in the market report are online and offline.
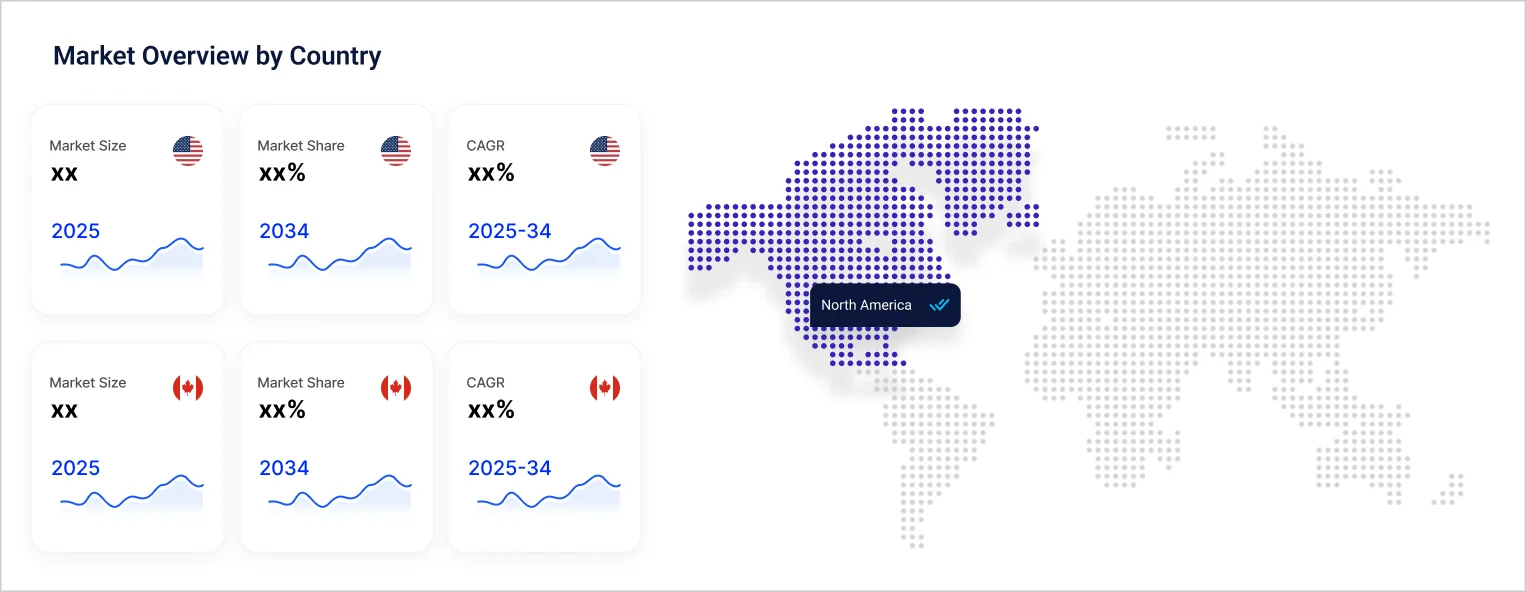
The different countries covered in the market report are the United States of America and Canada.
The key market players are Redfin Corporation, RE/MAX, LLC, Coldwell Banker Real Estate LLC, BHH Affiliates, LLC, Douglas Elliman, LLC, eXp World Holdings, Inc., Sotheby's International Realty Affiliates LLC, Weichert Co., Anywhere Real Estate Inc., and EXIT Realty Corp., among others.
Explore our key highlights of the report and gain a concise overview of key findings, trends, and actionable insights that will empower your strategic decisions.
| REPORT FEATURES | DETAILS |
| Base Year | 2025 |
| Historical Period | 2019-2025 |
| Forecast Period | 2026-2035 |
| Scope of the Report |
Historical and Forecast Trends, Industry Drivers and Constraints, Historical and Forecast Market Analysis by Segment:
|
| Breakup by Type |
|
| Breakup by Property |
|
| Breakup by Mode |
|
| Breakup by Region |
|
| Market Dynamics |
|
| Competitive Landscape |
|
| Companies Covered |
|
Datasheet
One User
USD 2,499
USD 2,249
tax inclusive*
Single User License
One User
USD 3,999
USD 3,599
tax inclusive*
Five User License
Five User
USD 4,999
USD 4,249
tax inclusive*
Corporate License
Unlimited Users
USD 5,999
USD 5,099
tax inclusive*
*Please note that the prices mentioned below are starting prices for each bundle type. Kindly contact our team for further details.*
Flash Bundle
Small Business Bundle
Growth Bundle
Enterprise Bundle
*Please note that the prices mentioned below are starting prices for each bundle type. Kindly contact our team for further details.*
Flash Bundle
Number of Reports: 3
20%
tax inclusive*
Small Business Bundle
Number of Reports: 5
25%
tax inclusive*
Growth Bundle
Number of Reports: 8
30%
tax inclusive*
Enterprise Bundle
Number of Reports: 10
35%
tax inclusive*
How To Order

Select License Type
Choose the right license for your needs and access rights.

Click on ‘Buy Now’
Add the report to your cart with one click and proceed to register.

Select Mode of Payment
Choose a payment option for a secure checkout. You will be redirected accordingly.
Gain insights to stay ahead and seize opportunities.

Get insights & trends for a competitive edge.

Track prices with detailed trend reports.

Analyse trade data for supply chain insights.

Leverage cost reports for smart savings

Enhance supply chain with partnerships.

Connect For More Information
Our expert team of analysts will offer full support and resolve any queries regarding the report, before and after the purchase.
Our expert team of analysts will offer full support and resolve any queries regarding the report, before and after the purchase.
We employ meticulous research methods, blending advanced analytics and expert insights to deliver accurate, actionable industry intelligence, staying ahead of competitors.
Our skilled analysts offer unparalleled competitive advantage with detailed insights on current and emerging markets, ensuring your strategic edge.
We offer an in-depth yet simplified presentation of industry insights and analysis to meet your specific requirements effectively.


Share