

Consumer Insights
Uncover trends and behaviors shaping consumer choices today
Procurement Insights
Optimize your sourcing strategy with key market data
Industry Stats
Stay ahead with the latest trends and market analysis.

The North America razor market was valued at USD 6230.46 Million in 2025. The industry is expected to grow at a CAGR of 3.70% during the forecast period of 2026-2035 to attain a valuation of USD 8959.99 Million by 2035.
Base Year
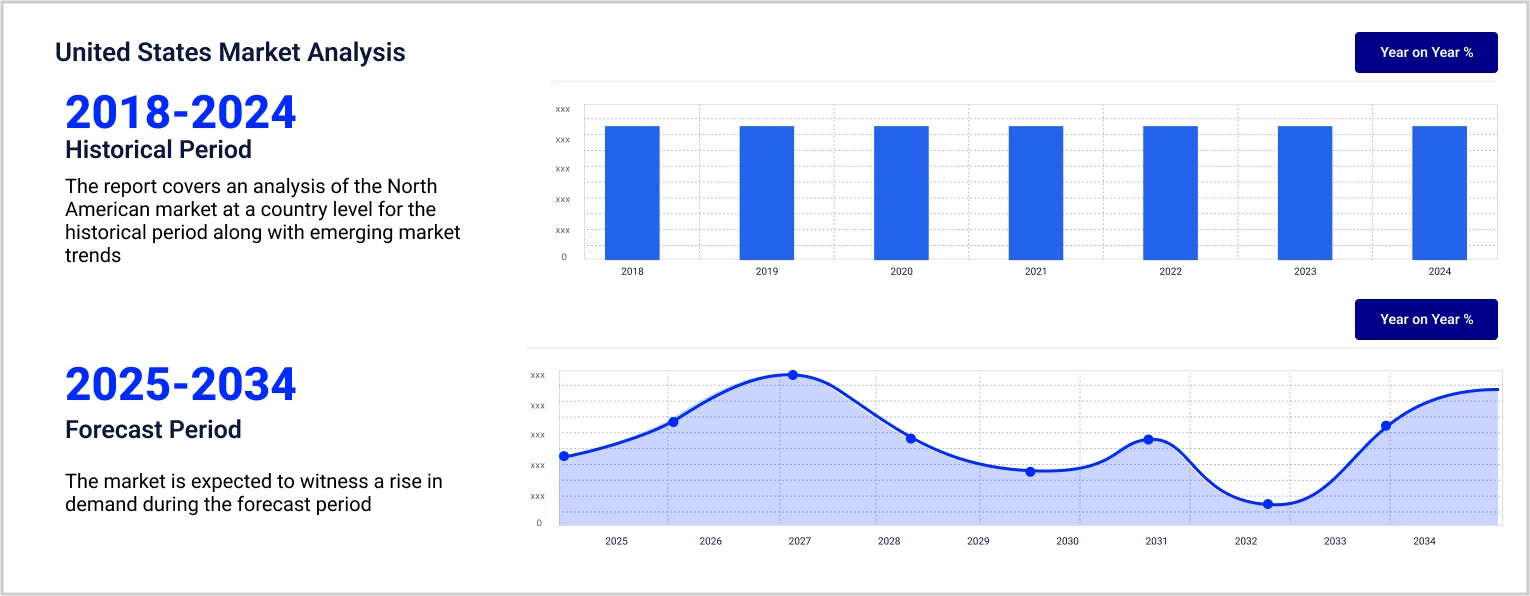
Historical Period
Forecast Period
As per industry reports, the average cost of a razor blade in the United States is USD 10.
An average American uses nearly 12 razor blades annually, which also contributes to North America razor market revenue.
While disposable razors last up to 5 shaves, cartridge razors can be used 15-20 times.
Compound Annual Growth Rate
3.7%
Value in USD Million
2026-2035
*this image is indicative*
| North America Razor Market Report Summary | Description | Value |
| Base Year | USD Million | 2025 |
| Historical Period | USD Million | 2019-2025 |
| Forecast Period | USD Million | 2026-2035 |
| Market Size 2025 | USD Million | 6230.46 |
| Market Size 2035 | USD Million | 8959.99 |
| CAGR 2019-2025 | Percentage | XX% |
| CAGR 2026-2035 | Percentage | 3.70% |
| CAGR 2026-2035 - Market by Country | United States | 2.8% |
| CAGR 2026-2035 - Market by Product Type | Electric | 3.4% |
| CAGR 2026-2035 - Market by Distribution Channel | Online | 4.9% |
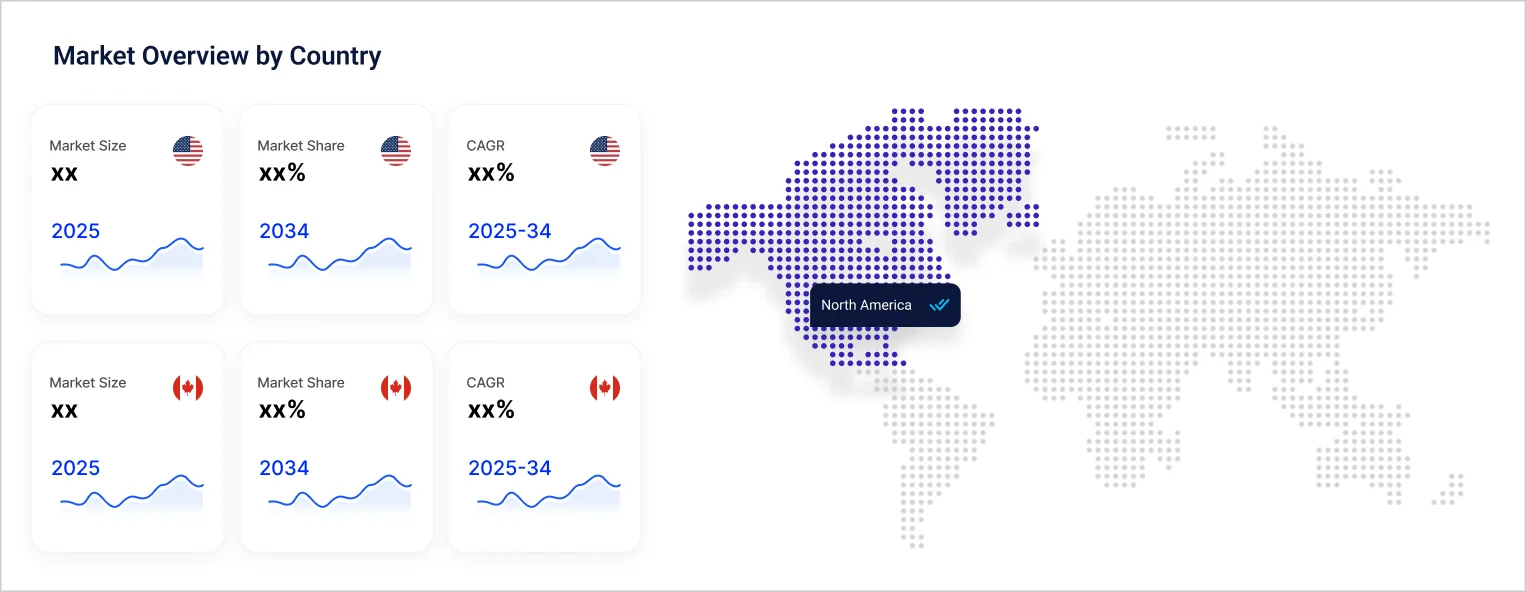
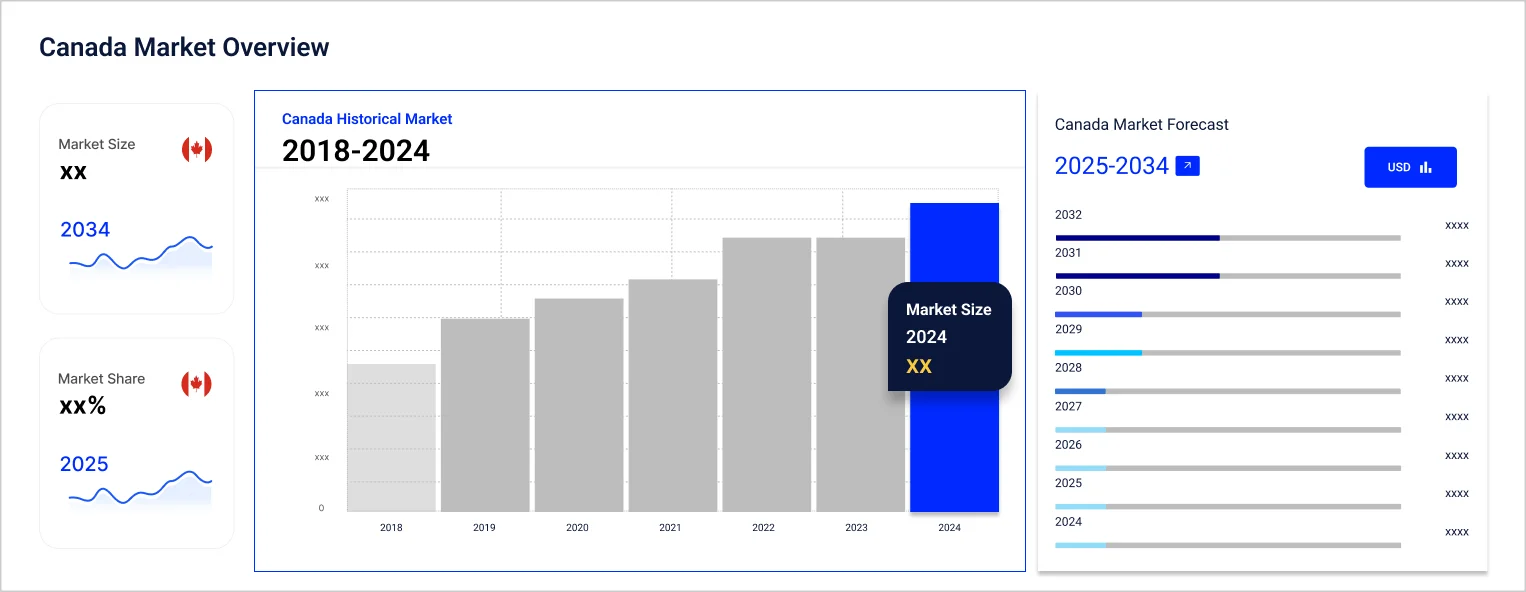
| 2025 Market Share by Country | Canada | 9.4% |
Cartridge razors have emerged as a preferred shaving product among North American consumers. This is because they are more durable and provide a closer and smoother shave. They have an ergonomic and non-slippery grip that enhances their durability, while the blade’s anti-friction coating serves to reduce skin irritation, thereby enhancing user comfort. Cartridge razors are relatively more eco-friendly than disposable razors, which is expected to contribute to the North America razor market value over the forecast period.
In 2019, an average Canadian household spent nearly USD 1,384 on purchasing personal care products. Between 2021 and 2022, in-store sales of beauty products surged by 34%. In 2022, the revenues of luxury cosmetics and personal care brands surged by nearly 25%. This highlights the increasing consumer preference for premium products. As per the North America razor market analysis, over 50% of Canadians chose personal care products based on their quality. In 2022, nearly 35% of all sales of beauty products occurred through online distribution channels in Canada. Nearly 86% of Canadians prefer paying extra for products with eco-friendly packaging, highlighting sustainability as a key differentiating strategy for razor manufacturers. The introduction of high-tech unisex razors that provide a smooth shaving experience for men and women is expected to increase the market expansion in the forecast period.
Revived demand for double-edged safety razors; the emergence of subscription services for razor blades; the growing adoption of sustainable business practices; and the rising demand for high-tech razors are trends impacting the North America razor market growth.
The demand for double-edged safety razors has been rising steadily due to rising consumer awareness about their durability and long lifespan. This is expected to spur the North America razor market expansion.
Popular razor brands like Harry’s Inc. provide razor blades on a subscription basis to consumers, which makes them more cost-effective and accessible for customers.
Many businesses producing razors are providing consumers with the option to return and recycle disposable razors via mail, thereby enhancing their demand. This is expected to spur the North America razor market development over the forecast period.
Razors with vibrating power functions are being increasingly preferred for their ability to ensure a smooth shaving experience among consumers.
Double-edged safety razors are generally manufactured from materials like chrome or steel, which makes them long-lasting and dependable. Emerging businesses that provide trendy personal care product to consumers via direct shipping have reintroduced these products to the Gen Z, which is raising their demand. The provision of municipal recycling services has substantially increased their adoption among adolescents and young adults, thereby driving the North America razor market development.
The EMR’s report titled “North America Razor Market Report and Forecast 2026-2035” offers a detailed analysis of the market based on the following segments:
Breakup by Product Type
Breakup by End User
Breakup by Distribution Channel
Breakup by Country
| CAGR 2026-2035 - Market by | Country |
| United States | 2.8% |
| Canada | XX% |
Based on region, the market is segmented into the United States of America and Canada. Canada is projected to dominate the market, representing 9% of the overall market share. Over the forecast period, the United States is expected to grow at a CAGR of 2.8%, as an increasing number of consumers shift towards the usage of sustainable shaving products. Moreover, the introduction of technologically advanced razors that provide a salon-like smooth shaving experience is expected to favourably impact the North America razor market dynamics.
| 2025 Market Share by | Country |
| Canada | 9.4% |
| United States | XX% |
Major players are partnering with material sciences companies to reduce the plastic content of their products and thereby, increase their North America razor market share by promoting sustainable razors.
Procter & Gamble Co. was formed in 1837 and is based in Ohio, United States. It is involved in the manufacturing, and distribution of various FMCG products, including personal care products like razors.
Edgewell Personal Care Co. was formed in 2015 and is based in Connecticut, United States. It is involved in producing personal care products for different sexes such as sunscreens, lotions, and razors, apart from products for children.
KAI Corp. was formed in 1908 and is based in Japan. As per North America razor market analysis, it is engaged in producing and marketing confectionery utensils, beauty products, and other items.
Dollar Shave Club, Inc. was formed in 2011 and is based in California, United States. It is involved in producing numerous high-quality grooming products for men.
*Please note that this is only a partial list; the complete list of key players is available in the full report. Additionally, the list of key players can be customized to better suit your needs.*
Other players included in the North America razor market report are Koninklijke Philips N.V., Harry's Inc., Societe BIC S.A., Dorco Co. Ltd., Ningbo Kaili Holding Group Co., Ltd., and Western Razor Company, among others.


Upto 15% Off
USD
$2499 $2249
$3999 $3599
$4999 $4249
$5999 $5099


*While we strive to always give you current and accurate information, the numbers depicted on the website are indicative and may differ from the actual numbers in the main report. At Expert Market Research, we aim to bring you the latest insights and trends in the market. Using our analyses and forecasts, stakeholders can understand the market dynamics, navigate challenges, and capitalize on opportunities to make data-driven strategic decisions.*
Get in touch with us for a customized solution tailored to your unique requirements and save upto 35%!
The market is assessed to grow at a CAGR of 3.70% between 2026 and 2035.
The different types of products in the market are cartridge, disposable, and electric.
The different distribution channels in the market are supermarkets and hypermarkets, convenience stores, and online, among others
The different countries covered in the market report are the United States of America and Canada.
Key players in the market are Procter & Gamble Co., Koninklijke Philips N.V., Edgewell Personal Care Co., Harry's Inc., Societe BIC S.A., Dorco Co. Ltd., Ningbo Kaili Holding Group Co., Ltd., KAI Corp., Dollar Shave Club, Inc., and Western Razor Company, among others.
In 2025, the market attained a value of nearly USD 6230.46 Million.
The market is estimated to witness a healthy growth in the forecast period of 2026-2035 to reach about USD 8959.99 Million by 2035.
Explore our key highlights of the report and gain a concise overview of key findings, trends, and actionable insights that will empower your strategic decisions.
| REPORT FEATURES | DETAILS |
| Base Year | 2025 |
| Historical Period | 2019-2025 |
| Forecast Period | 2026-2035 |
| Scope of the Report |
Historical and Forecast Trends, Industry Drivers and Constraints, Historical and Forecast Market Analysis by Segment
|
| Breakup by Product Type |
|
| Breakup by Consumer |
|
| Breakup by Distribution Channel |
|
| Breakup by Region |
|
| Market Dynamics |
|
| Competitive Landscape |
|
| Companies Covered |
|
Datasheet
One User
USD 2,499
USD 2,249
tax inclusive*
Single User License
One User
USD 3,999
USD 3,599
tax inclusive*
Five User License
Five User
USD 4,999
USD 4,249
tax inclusive*
Corporate License
Unlimited Users
USD 5,999
USD 5,099
tax inclusive*
*Please note that the prices mentioned below are starting prices for each bundle type. Kindly contact our team for further details.*
Flash Bundle
Small Business Bundle
Growth Bundle
Enterprise Bundle
*Please note that the prices mentioned below are starting prices for each bundle type. Kindly contact our team for further details.*
Flash Bundle
Number of Reports: 3
20%
tax inclusive*
Small Business Bundle
Number of Reports: 5
25%
tax inclusive*
Growth Bundle
Number of Reports: 8
30%
tax inclusive*
Enterprise Bundle
Number of Reports: 10
35%
tax inclusive*
How To Order

Select License Type
Choose the right license for your needs and access rights.

Click on ‘Buy Now’
Add the report to your cart with one click and proceed to register.

Select Mode of Payment
Choose a payment option for a secure checkout. You will be redirected accordingly.
Gain insights to stay ahead and seize opportunities.

Get insights & trends for a competitive edge.

Track prices with detailed trend reports.

Analyse trade data for supply chain insights.

Leverage cost reports for smart savings

Enhance supply chain with partnerships.

Connect For More Information
Our expert team of analysts will offer full support and resolve any queries regarding the report, before and after the purchase.
Our expert team of analysts will offer full support and resolve any queries regarding the report, before and after the purchase.
We employ meticulous research methods, blending advanced analytics and expert insights to deliver accurate, actionable industry intelligence, staying ahead of competitors.
Our skilled analysts offer unparalleled competitive advantage with detailed insights on current and emerging markets, ensuring your strategic edge.
We offer an in-depth yet simplified presentation of industry insights and analysis to meet your specific requirements effectively.


Share