

Consumer Insights
Uncover trends and behaviors shaping consumer choices today
Procurement Insights
Optimize your sourcing strategy with key market data
Industry Stats
Stay ahead with the latest trends and market analysis.

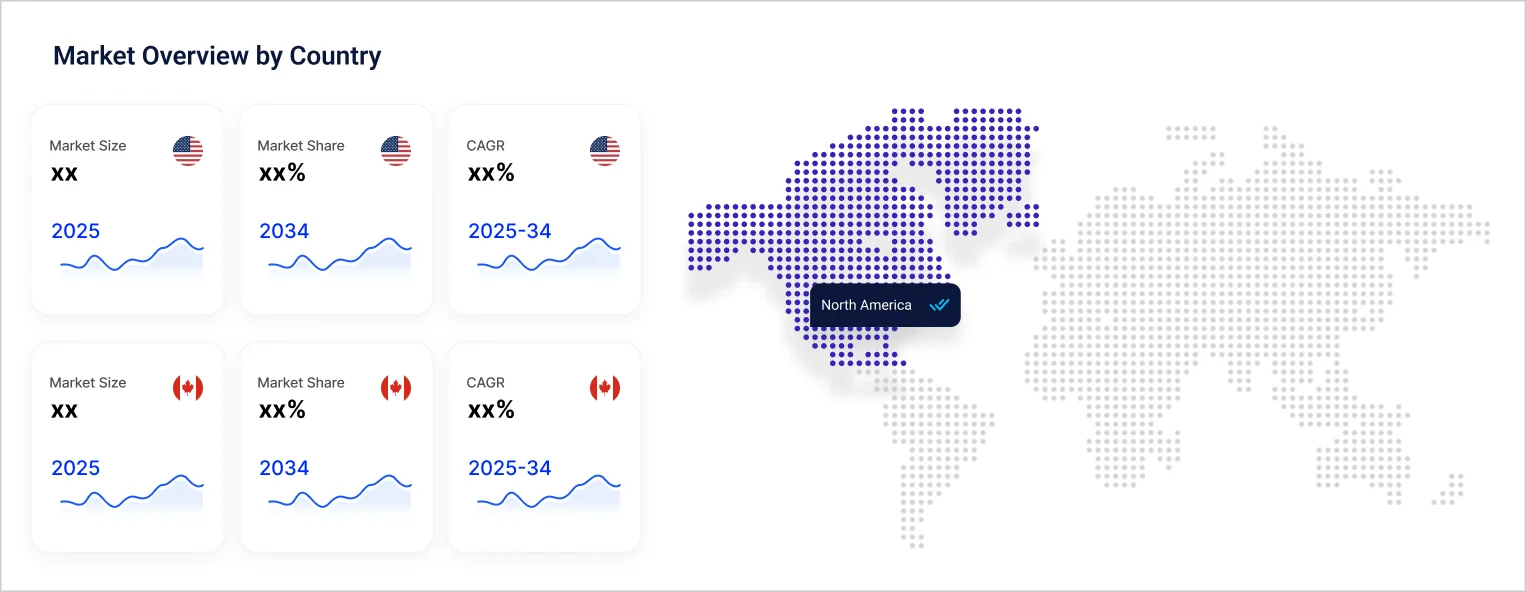
The North America protein bar market size reached USD 2.02 Billion in 2025. The market is expected to grow at a CAGR of 6.10% between 2026 and 2035, reaching almost USD 3.65 Billion by 2035.
Base Year
Historical Period
Forecast Period
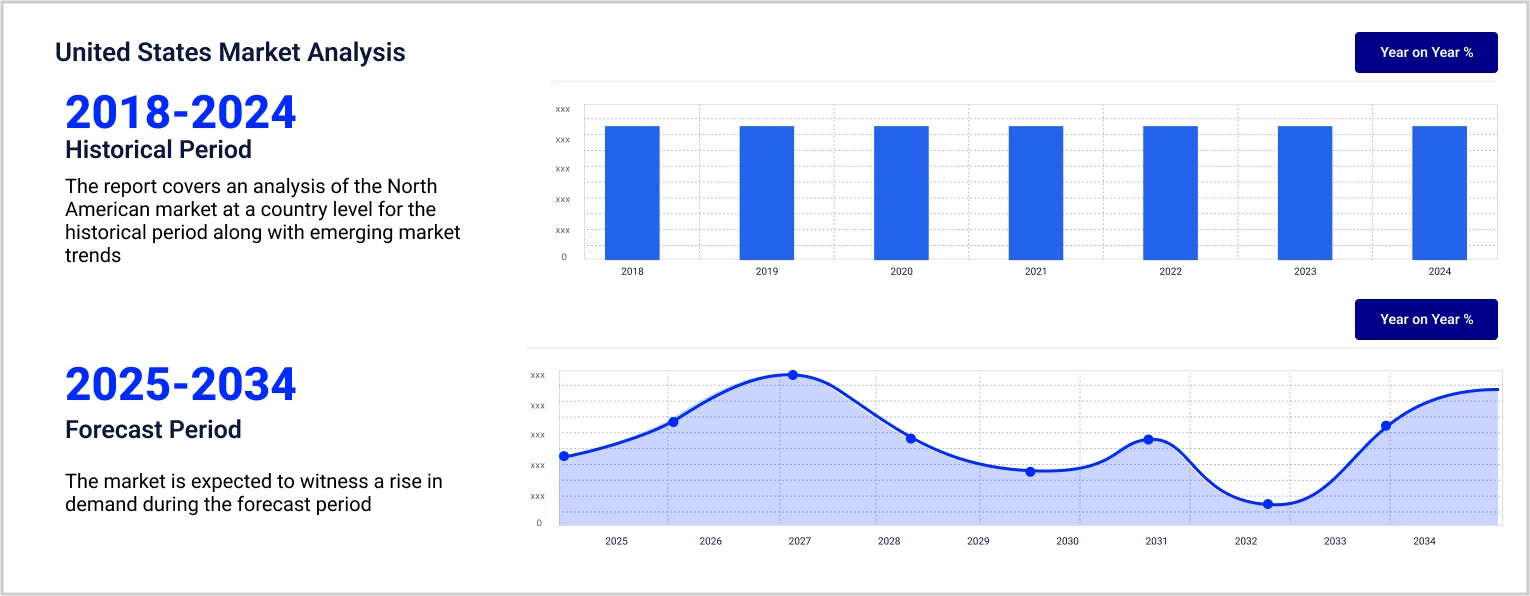
In 2023, approximately 64.19 million individuals in the United States were enrolled in gym or health club memberships, marking a significant figure in the country's fitness landscape. This surge reflects a growing consciousness toward maintaining good health among consumers, leading to a preference for low-fat and oil-free products. This trend has notably redirected consumer interest toward the protein bar market in North America.
The United States boasts the highest number of gym memberships globally, with an estimated 64.19 million individuals enrolled. Over the period spanning from 2000 to 2019, gym memberships in the U.S. nearly doubled, increasing from 32.8 million to 64.2 million.
The industry of gym, health, and fitness clubs in the United States provides employment opportunities for an estimated 823,652 individuals. California stands out as the state with the most health and fitness gyms in the country, totalling 5,123 establishments.
As of 2022, the United States houses a total of 106,132 fitness businesses, reflecting a slight increase from the previous year's count of 103,626.
Compound Annual Growth Rate
6.1%
Value in USD Billion
2026-2035
*this image is indicative*
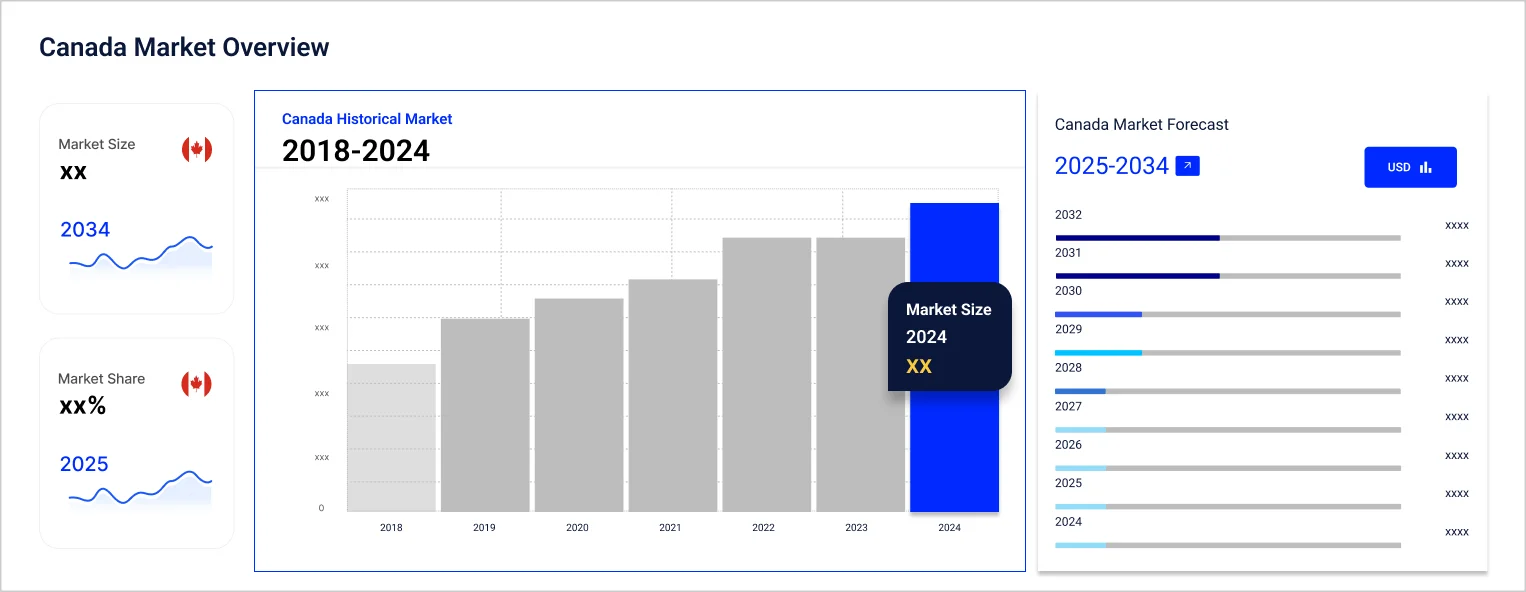
The surge in protein bar consumption is primarily driven by heightened consumer awareness of health benefits. Offering substantial protein content (10-20 grams), vitamin B, and 150-200 calories, protein bars are favoured by fitness enthusiasts across North America. The United States leads in consumption, with a burgeoning gym membership of 64.19 million in 2023, spurred by a trend towards exercise and outdoor activities for maintaining good health. In Canada, protein bars are increasingly viewed as convenient meal replacements, driving market growth. Producers are diversifying offerings with varied price ranges and innovative flavours to attract consumers in the North America protein bar market.
Consumer preference is shifting towards wholesome and convenient snacking options like protein bars, driven by increased health consciousness. Recognising the benefits of protein bars in tissue building, weight management, and overall nutrition, consumers are gravitating towards these products. Moreover, the fitness industry's promotion of protein bars as meal replacements further fuels demand. The uncertain global climate has intensified interest in nutritional supplements, leading consumers to prioritise health and wellness through healthier eating habits.
As demand grows, manufacturers are innovating with new flavours and formats to cater to diverse tastes and dietary preferences. This includes introducing flavours like salted caramel and chocolate chip cookie dough and incorporating additional nutrients like fibre and vitamins. Plant-based protein bars are also gaining popularity among vegan consumers, aligning with rising demand for plant-based products driven by environmental and health concerns.
Market players are investing heavily in research and development to expand product lines and enhance market presence. Strategic initiatives such as new product launches, partnerships, and mergers are undertaken to capitalize on the expanding market. As competition intensifies, cost-effective offerings are crucial for market expansion and survival in this dynamic landscape while driving the North America protein bar market development.
"North America Protein Bar Market Report and Forecast 2026-2035" offers a detailed analysis of the market based on the following segments:
Market Breakup by Nature
Market Breakup by Distribution Channel
Market Breakup by Country
Key players are introducing various types or protein bars while also undertaking acquisition activities to stay ahead in the competition.


Upto 15% Off
USD
$2499 $2249
$3999 $3599
$4999 $4249
$5999 $5099


*While we strive to always give you current and accurate information, the numbers depicted on the website are indicative and may differ from the actual numbers in the main report. At Expert Market Research, we aim to bring you the latest insights and trends in the market. Using our analyses and forecasts, stakeholders can understand the market dynamics, navigate challenges, and capitalize on opportunities to make data-driven strategic decisions.*
Get in touch with us for a customized solution tailored to your unique requirements and save upto 35%!
The market is estimated to be valued at USD 2.02 Billion in 2025.
The market is projected to grow at a CAGR of 6.10% between 2026 and 2035.
The protein bar market is expected to reach USD 3.65 Billion in 2035.
The market is categorised according to its nature, which includes organic and conventional.
The key market players are Nestlé S.A., Kellogg Co., PepsiCo, Inc., General Mills Inc., Mondelez Global Direct Inc., Abbott Laboratories Co., WorldPantry.com LLC, KIND LLC, Caveman Foods LLC, Lotus Bakeries NV, and others.
The market is driven by factors that include heightened health awareness, rising demand for convenience food, and increasing investments in research and development activities, among others.
The market is categorised according to its distribution channel, which includes supermarkets and hypermarkets, convenience stores, online stores, and others.
Over half (51%) of adults in the United States regularly enjoy all-purpose snack bars and also explore various other types of bar products. A significant portion, one-quarter, opt for meal replacement bars, while 36% prefer snack or nutrition protein bars. Additionally, 35% opt for fibre bars, and 22% opt for nutrition bars.
Explore our key highlights of the report and gain a concise overview of key findings, trends, and actionable insights that will empower your strategic decisions.
| REPORT FEATURES | DETAILS |
| Base Year | 2025 |
| Historical Period | 2019-2025 |
| Forecast Period | 2026-2035 |
| Scope of the Report |
Historical and Forecast Trends, Industry Drivers and Constraints, Historical and Forecast Market Analysis by Segment:
|
| Breakup by Nature |
|
| Breakup by Distribution Channel |
|
| Breakup by Country |
|
| Market Dynamics |
|
| Competitive Landscape |
|
| Companies Covered |
|
Datasheet
One User
USD 2,499
USD 2,249
tax inclusive*
Single User License
One User
USD 3,999
USD 3,599
tax inclusive*
Five User License
Five User
USD 4,999
USD 4,249
tax inclusive*
Corporate License
Unlimited Users
USD 5,999
USD 5,099
tax inclusive*
*Please note that the prices mentioned below are starting prices for each bundle type. Kindly contact our team for further details.*
Flash Bundle
Small Business Bundle
Growth Bundle
Enterprise Bundle
*Please note that the prices mentioned below are starting prices for each bundle type. Kindly contact our team for further details.*
Flash Bundle
Number of Reports: 3
20%
tax inclusive*
Small Business Bundle
Number of Reports: 5
25%
tax inclusive*
Growth Bundle
Number of Reports: 8
30%
tax inclusive*
Enterprise Bundle
Number of Reports: 10
35%
tax inclusive*
How To Order

Select License Type
Choose the right license for your needs and access rights.

Click on ‘Buy Now’
Add the report to your cart with one click and proceed to register.

Select Mode of Payment
Choose a payment option for a secure checkout. You will be redirected accordingly.
Gain insights to stay ahead and seize opportunities.

Get insights & trends for a competitive edge.

Track prices with detailed trend reports.

Analyse trade data for supply chain insights.

Leverage cost reports for smart savings

Enhance supply chain with partnerships.

Connect For More Information
Our expert team of analysts will offer full support and resolve any queries regarding the report, before and after the purchase.
Our expert team of analysts will offer full support and resolve any queries regarding the report, before and after the purchase.
We employ meticulous research methods, blending advanced analytics and expert insights to deliver accurate, actionable industry intelligence, staying ahead of competitors.
Our skilled analysts offer unparalleled competitive advantage with detailed insights on current and emerging markets, ensuring your strategic edge.
We offer an in-depth yet simplified presentation of industry insights and analysis to meet your specific requirements effectively.


Share