

Consumer Insights
Uncover trends and behaviors shaping consumer choices today
Procurement Insights
Optimize your sourcing strategy with key market data
Industry Stats
Stay ahead with the latest trends and market analysis.
Trending Now


The North America proppant market size reached a value of approximately USD 1.22 Billion in 2024. The market is further expected to grow at a CAGR of 11.20% between 2025 and 2034, reaching a value of around USD 3.53 Billion by 2034.
Base Year
Historical Period
Forecast Period


Value in USD Billion
2025-2034
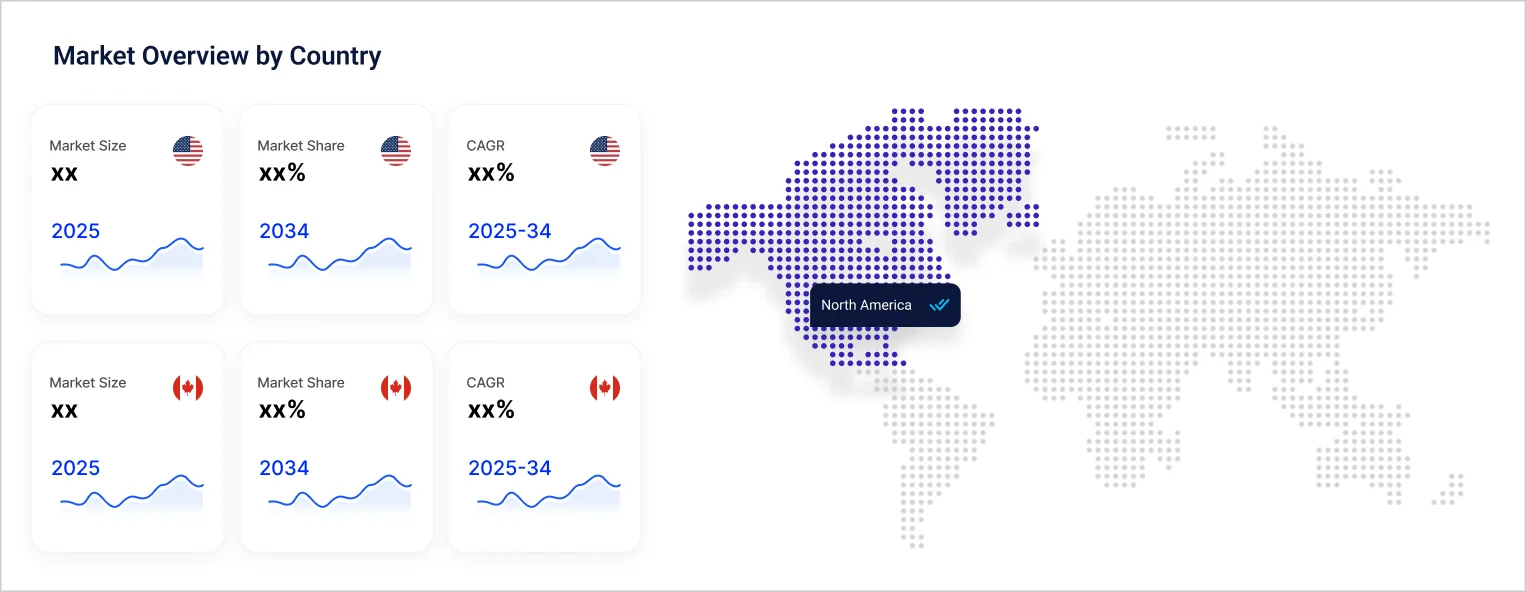
North America Proppant Market Outlook
*this image is indicative*
Proppants refer to consistently sized, grit-like granules that are used with fracturing fluid during the hydraulic fracturing (fracking) procedure to maintain open earth fractures. They aid in the extraction of oil and gas by creating a path for more freely flowing hydrocarbons.

Read more about this report - REQUEST FREE SAMPLE COPY IN PDF
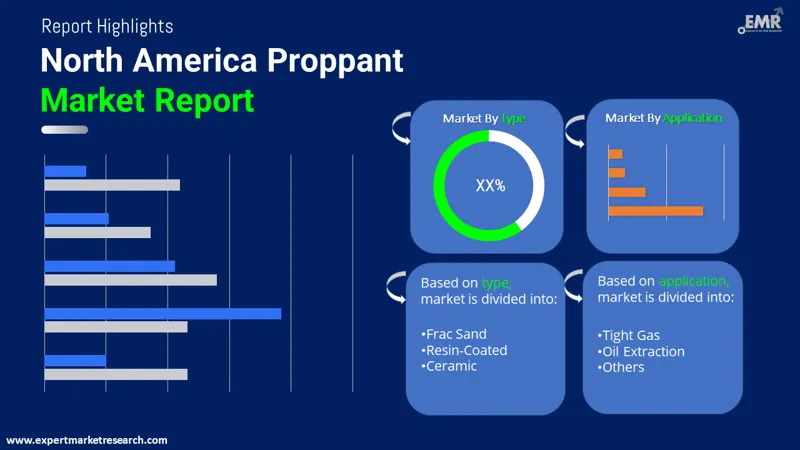
The EMR’s report titled “North America Proppant Market Report and Forecast 2025-2034” offers a detailed analysis of the market based on the following segments:
Market Breakup by Type
Market Breakup by Application
Market Breakup by Country
Read more about this report - REQUEST FREE SAMPLE COPY IN PDF
Frac sand accounts for a sizable share of the North America proppant market by type as it is a popular component for hydraulic fracturing. Due to the abundance of advantageous shale basins and rising natural gas consumption in the region, there is a significant increase in demand for frac sand. Round-grain, extremely resistant sand is used to create frac sand proppants. The volume of frac sand needed per well is projected to rise during the forecast period due to the rise in ageing fields, and the expansion of horizontal drilling and shale gas production operations.
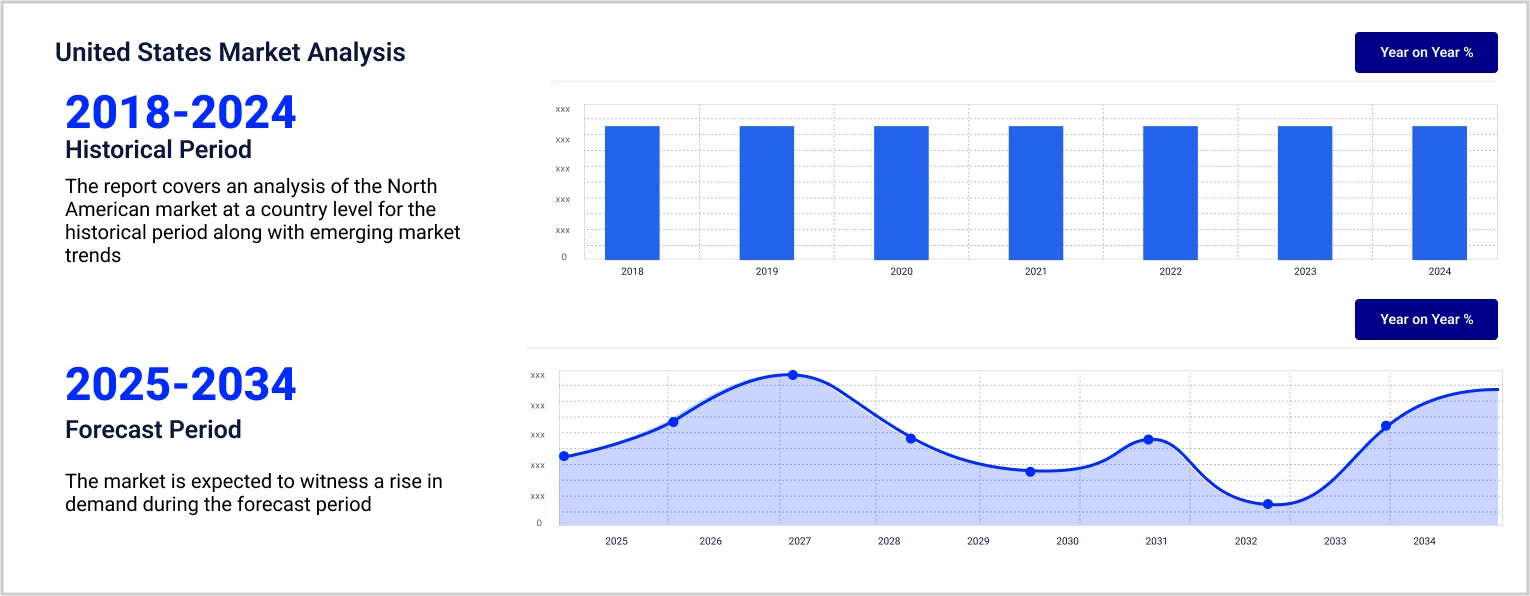
The United States is one of the major countries in the proppant market of North America, supported by the exploration of unconventional crude oil reserves and the use of hydraulic fracturing. Compared to oil produced from conventionally fractured wells, the amount of oil produced from hydraulically fractured wells has been steadily rising. The North America proppant market has been positively impacted by the expanding use of hydraulic fracturing in the United States, particularly for shale gas and tight oil purposes.
The comprehensive EMR report provides an in-depth assessment of the market based on the Porter's five forces model along with giving a SWOT analysis. The report gives a detailed analysis of the following key players in the North America proppant market, covering their competitive landscape and the latest developments like mergers, acquisitions, investments, and expansion plans.
Covia Holdings LLC, founded in 1970 and headquartered in Ohio in the United States, is a supplier of minerals and material solutions for the industrial and energy markets. The company offers a range of mineral solutions for applications such as polymers, glass, ceramics, water filtration, coatings, construction, sports, and leisure.
Imerys S.A., established in 1880, is a global pioneer in mineral-based speciality products with headquarters in Paris, France. The company provides high value-added solutions to a wide range of industries, including process manufacturing and consumer goods.
CARBO Ceramics Inc., founded in 1979, is a leading provider of ceramic proppant. With headquarters in Texas in the United States, CARBO Ceramics offers fracture simulation software, and also provides fracture design and consulting services.
*Please note that this is only a partial list; the complete list of key players is available in the full report. Additionally, the list of key players can be customized to better suit your needs.*
Other market players include Compagnie de Saint-Gobain S.A., Badger Mining Corporation, Eagle Materials Inc., Preferred Sands, U.S. Silica Holdings, Inc, US Ceramics, LLC, and Hexion Inc., among others.
Trade Surveillance System Market
Optical Brightening Agents Market
Mexico Paints And Coatings Market
South Africa Conveyor Belt Market
North America Battery Storage Service Market
Contract Lifecycle Management Software Market
Photoresist And Photoresist Ancillaries Market
North America Below Grade Waterproofing Market
*While we strive to always give you current and accurate information, the numbers depicted on the website are indicative and may differ from the actual numbers in the main report. At Expert Market Research, we aim to bring you the latest insights and trends in the market. Using our analyses and forecasts, stakeholders can understand the market dynamics, navigate challenges, and capitalize on opportunities to make data-driven strategic decisions.*
Get in touch with us for a customized solution tailored to your unique requirements and save upto 35%!
In 2024, the North America market for proppant attained a value of approximately USD 1.22 Billion.
The proppant market in North America is projected to grow at a CAGR of CAGR of 11.20% between 2025 and 2034.
The market is estimated to witness healthy growth in the forecast period of 2025-2034 to reach USD 3.53 Billion by 2034.
The major drivers of the market include the increase in production of oil and shale gas, rapid industrialisation, and use of proppant sand for hydraulic fracturing.
Improvements in fracking technology, increasing usage of frac sand, and shifting focus toward the usage of ceramic proppants are the key trends propelling the growth of the market.
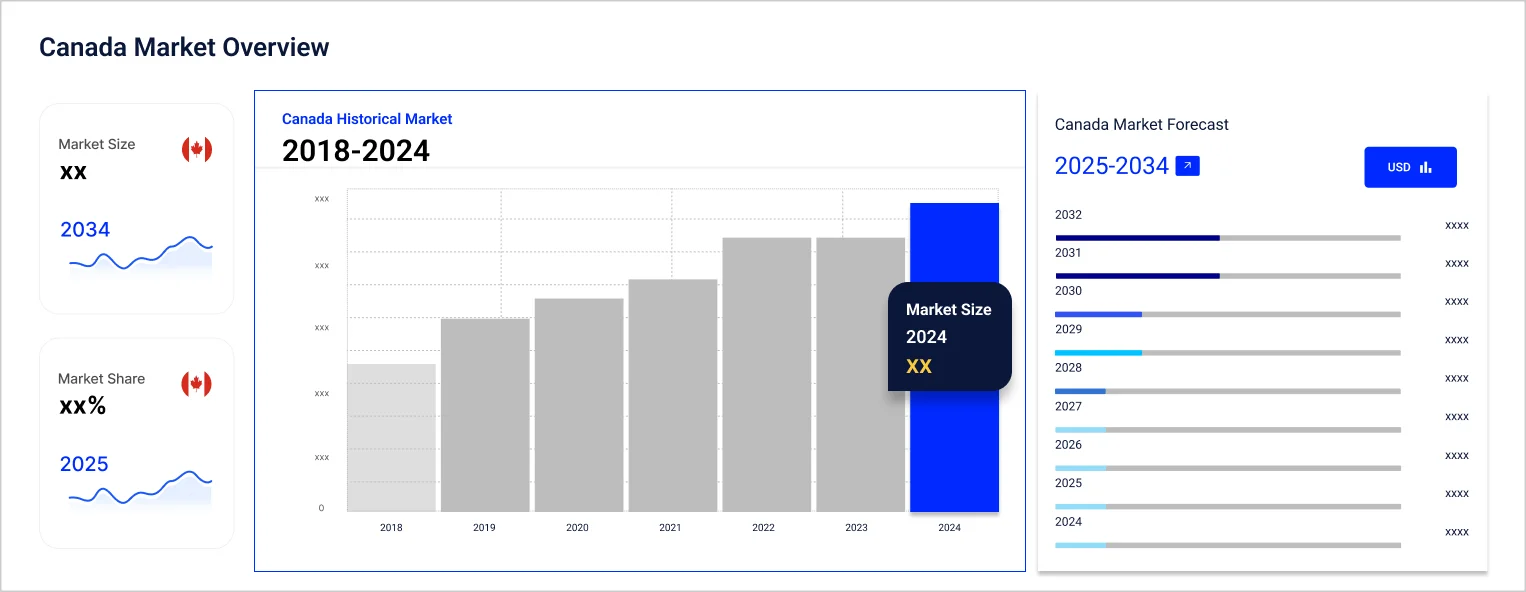
The major countries in the market are the United States and Canada.
The various applications of proppant in the market are shale gas, tight gas, and oil extraction, among others.
The major players in the North America proppant market, according to the report, are Compagnie de Saint-Gobain S.A., Badger Mining Corporation, Covia Holdings LLC, Imerys S.A., Eagle Materials Inc., Preferred Sands, U.S. Silica Holdings, Inc, CARBO Ceramics Inc., US Ceramics, LLC, and Hexion Inc., among others.
Explore our key highlights of the report and gain a concise overview of key findings, trends, and actionable insights that will empower your strategic decisions.
| REPORT FEATURES | DETAILS |
| Base Year | 2024 |
| Historical Period | 2018-2024 |
| Forecast Period | 2025-2034 |
| Scope of the Report |
Historical and Forecast Trends, Industry Drivers and Constraints, Historical and Forecast Market Analysis by Segment:
|
| Breakup by Type |
|
| Breakup by Application |
|
| Breakup by Country |
|
| Market Dynamics |
|
| Competitive Landscape |
|
| Companies Covered |
|
Datasheet
One User
USD 2,499
USD 2,249
tax inclusive*
Single User License
One User
USD 3,999
USD 3,599
tax inclusive*
Five User License
Five User
USD 4,999
USD 4,249
tax inclusive*
Corporate License
Unlimited Users
USD 5,999
USD 5,099
tax inclusive*
*Please note that the prices mentioned below are starting prices for each bundle type. Kindly contact our team for further details.*
Flash Bundle
Small Business Bundle
Growth Bundle
Enterprise Bundle
*Please note that the prices mentioned below are starting prices for each bundle type. Kindly contact our team for further details.*
Flash Bundle
Number of Reports: 3
20%
tax inclusive*
Small Business Bundle
Number of Reports: 5
25%
tax inclusive*
Growth Bundle
Number of Reports: 8
30%
tax inclusive*
Enterprise Bundle
Number of Reports: 10
35%
tax inclusive*
How To Order
Our step-by-step guide will help you select, purchase, and access your reports swiftly, ensuring you get the information that drives your decisions, right when you need it.

Select License Type
Choose the right license for your needs and access rights.

Click on ‘Buy Now’
Add the report to your cart with one click and proceed to register.

Select Mode of Payment
Choose a payment option for a secure checkout. You will be redirected accordingly.
Track prices with detailed trend reports.

Analyse trade data for supply chain insights.

Leverage cost reports for smart savings

Enhance supply chain with partnerships.

Gain insights to stay ahead and seize opportunities.

Get insights & trends for a competitive edge.

Track prices with detailed trend reports.
Analyse trade data for supply chain insights.
Leverage cost reports for smart savings
Enhance supply chain with partnerships.
Gain insights to stay ahead and seize opportunities.
Get insights & trends for a competitive edge.
Track prices with detailed trend reports.
Analyse trade data for supply chain insights.
Connect For More Information
Our expert team of analysts will offer full support and resolve any queries regarding the report, before and after the purchase.
Our expert team of analysts will offer full support and resolve any queries regarding the report, before and after the purchase.
We employ meticulous research methods, blending advanced analytics and expert insights to deliver accurate, actionable industry intelligence, staying ahead of competitors.
Our skilled analysts offer unparalleled competitive advantage with detailed insights on current and emerging markets, ensuring your strategic edge.
We offer an in-depth yet simplified presentation of industry insights and analysis to meet your specific requirements effectively.
Australia
63 Fiona Drive, Tamworth, NSW
+61-448-061-727
India
C130 Sector 2 Noida, Uttar Pradesh 201301
+91-723-689-1189
Philippines
40th Floor, PBCom Tower, 6795 Ayala Avenue Cor V.A Rufino St. Makati City,1226.
+63-287-899-028, +63-967-048-3306
United Kingdom
6 Gardner Place, Becketts Close, Feltham TW14 0BX, Greater London
+44-753-713-2163
United States
30 North Gould Street, Sheridan, WY 82801
+1-415-325-5166
Vietnam
193/26/4 St.no.6, Ward Binh Hung Hoa, Binh Tan District, Ho Chi Minh City
+84-865-399-124
United States (Head Office)
30 North Gould Street, Sheridan, WY 82801
+1-415-325-5166
Australia
63 Fiona Drive, Tamworth, NSW
+61-448-061-727
India
C130 Sector 2 Noida, Uttar Pradesh 201301
+91-723-689-1189
Philippines
40th Floor, PBCom Tower, 6795 Ayala Avenue Cor V.A Rufino St. Makati City, 1226.
+63-287-899-028, +63-967-048-3306
United Kingdom
6 Gardner Place, Becketts Close, Feltham TW14 0BX, Greater London
+44-753-713-2163
Vietnam
193/26/4 St.no.6, Ward Binh Hung Hoa, Binh Tan District, Ho Chi Minh City
+84-865-399-124


Share