

Consumer Insights
Uncover trends and behaviors shaping consumer choices today
Procurement Insights
Optimize your sourcing strategy with key market data
Industry Stats
Stay ahead with the latest trends and market analysis.

The North America phenol market attained a volume of 4.02 Million Tons in 2025. The market is further projected to grow at a CAGR of 3.60% between 2026 and 2035, reaching a volume of 5.73 Million Tons by 2035.
Base Year
Historical Period
Forecast Period
The major factors influencing North America phenol market development include the increasing demand for phenol-based resins and polymers in various end-use industries such as automotive, electronics, and construction.
As per industry reports, the key countries in the world accounting for over 68% of the total phenol capacity in 2022 include China, the US, South Korea, Taiwan, and Germany.
The market is driven predominantly by demand for BPA, which accounts for nearly half of global phenol consumption. Consumption of BPA is driven by demand for polycarbonate products.
Compound Annual Growth Rate
3.6%
Value in Million Tons
2026-2035
*this image is indicative*
There is a growing demand for phenol derivatives in North America, driven by their wide range of applications in industries such as pharmaceuticals, chemicals, and electronics. This trend is boosting the overall consumption of phenol and its derivatives, leading to North America phenol market growth and expansion. For instance, in 2022, the phenol capacity was 15.65 million tonnes per annum (mtpa), which is expected to grow further. Companies like INEOS Phenol and Mitsui Chemicals are expanding their product lines to include a wide range of phenol derivatives, catering to the growing demand for these products in industries such as pharmaceuticals, chemicals, and electronics.
Advancements in manufacturing processes, such as the cumene process, Dow process, and Ranching-Hooker process, are enhancing the efficiency and sustainability of phenol production in North America. These technological innovations are driving market growth and improving the overall competitiveness of the industry. Companies like Shell and SABIC are investing in technological advancements in manufacturing processes. These innovations are enhancing the efficiency and sustainability of phenol production.
As per North America phenol market analysis, phenolic resins are widely used in various applications, including the production of adhesives, coatings, and insulation materials. Major producers of phenolic resins in North America include Hexion, BASF, and Georgia-Pacific Chemicals. The demand for phenolic resins is driven by their versatility and wide range of applications, particularly in the construction and automotive industries.
Caprolactam is a key intermediate in the production of nylon 6 fibres and resins, with significant demand from the textile, automotive, and electronics industries. Major producers of caprolactam in North America include Ascend Performance Materials, Invista, and BASF.
"North America Phenol Industry Report and Forecast 2026-2035" offers a detailed analysis of the market based on the following segments:
Market Breakup by Product Type
Market Breakup by Country
Market players are focusing on expanding their production capacity and investing in research and development activities to develop new and innovative phenol-based products.


Upto 15% Off
USD
$2499 $2249
$3999 $3599
$4999 $4249
$5999 $5099


*While we strive to always give you current and accurate information, the numbers depicted on the website are indicative and may differ from the actual numbers in the main report. At Expert Market Research, we aim to bring you the latest insights and trends in the market. Using our analyses and forecasts, stakeholders can understand the market dynamics, navigate challenges, and capitalize on opportunities to make data-driven strategic decisions.*
Get in touch with us for a customized solution tailored to your unique requirements and save upto 35%!
In 2025, the market attained a volume of 4.02 Million Tons.
The market is expected to grow at a CAGR of 3.60% between 2026 and 2035.
The phenol market is estimated to witness a healthy growth in the forecast period of 2026-2035 to reach a value of 5.73 Million Tons by 2035.
The popularity of phenol-based products in sectors such as automotive, construction, electronics, and healthcare has fuelled the demand for phenol in the region.
Key trends aiding the market expansion include increasing demand for phenol from the electronics industry, presence of many chemical manufacturing facilities, and favourable government policies.
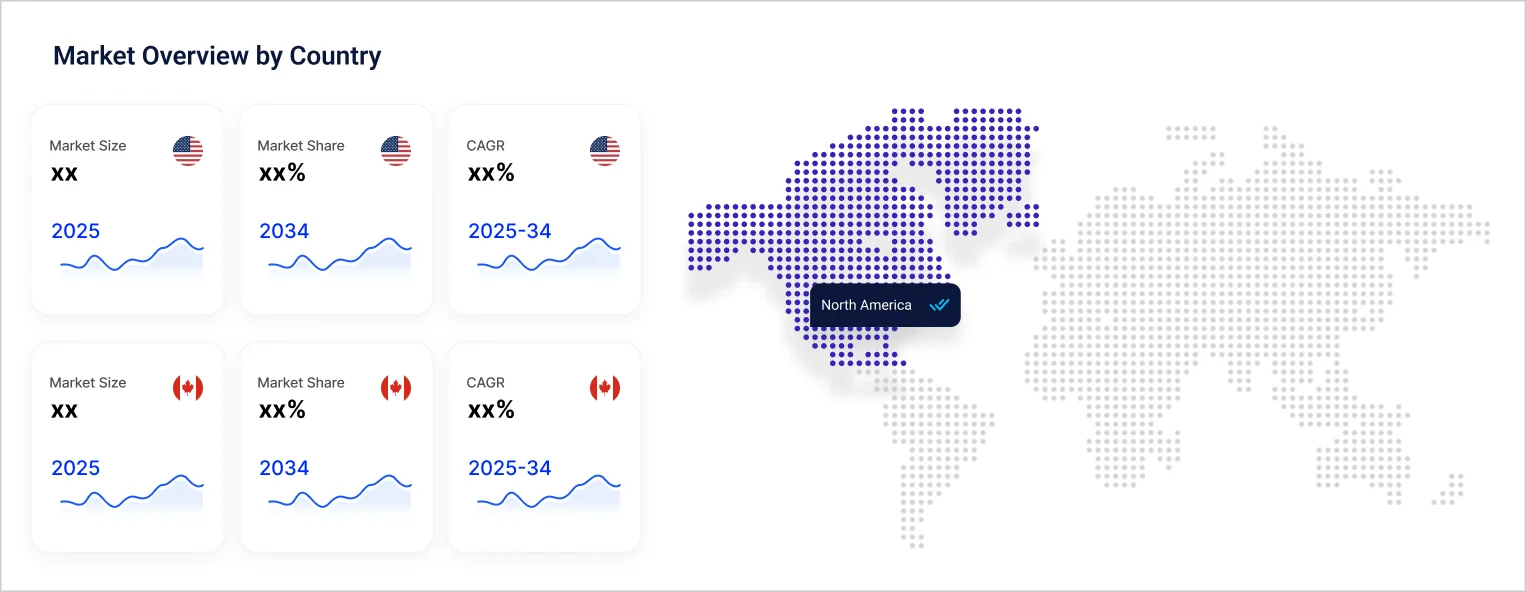
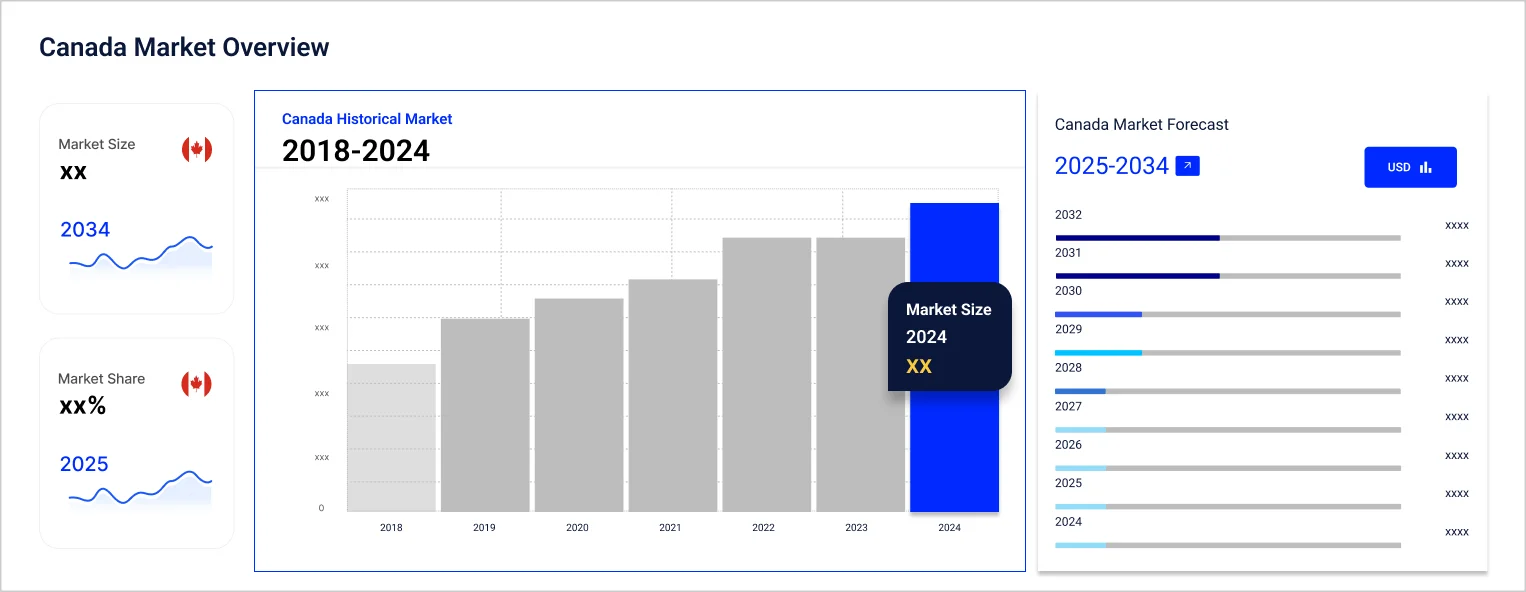
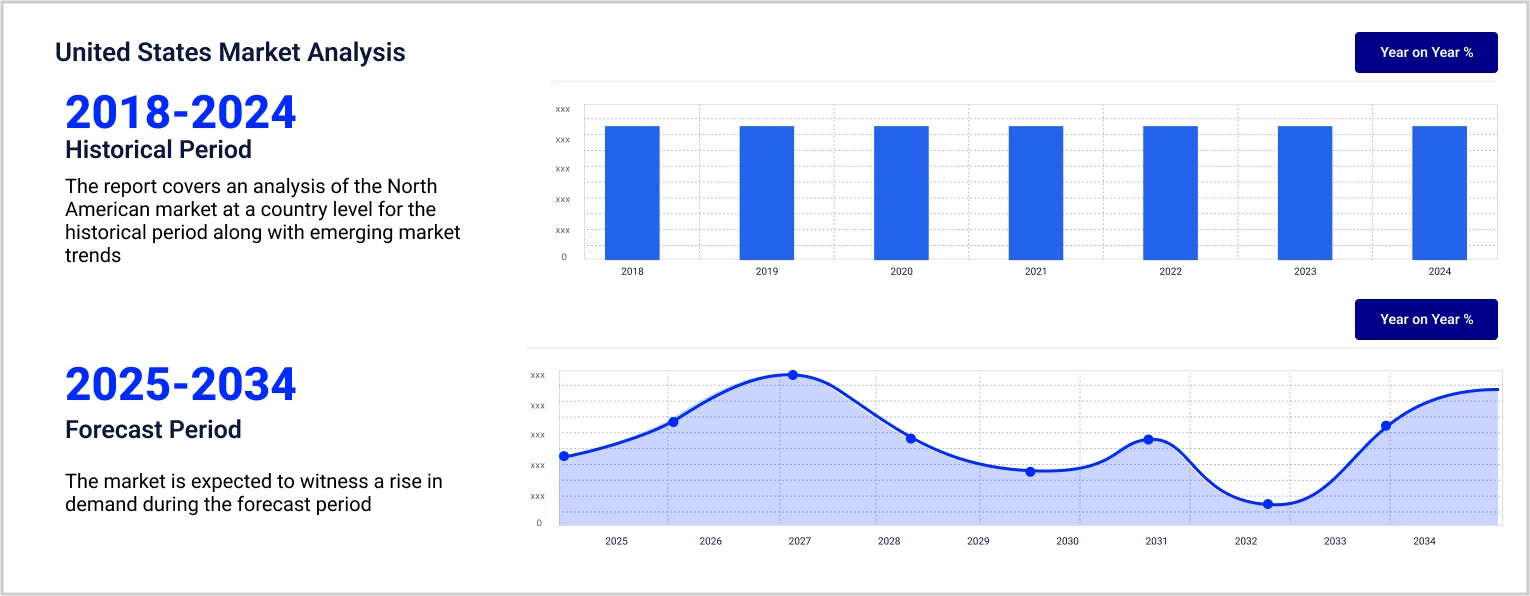
Countries considered in the market are United States of America and Canada.
Based on product type, the market segmentations include phenolic resin, bisphenol A, and caprolactam, among others.
Key players in the market are INEOS AG, Mitsubishi Chemical Group Corporation, Honeywell International Inc., Shell PLC, Solvay SA, ALTIVIA, AdvanSix Inc., Capital Resin Corporation, and SI Group, Inc., among others.
Explore our key highlights of the report and gain a concise overview of key findings, trends, and actionable insights that will empower your strategic decisions.
| REPORT FEATURES | DETAILS |
| Base Year | 2025 |
| Historical Period | 2019-2025 |
| Forecast Period | 2026-2035 |
| Scope of the Report |
Historical and Forecast Trends, Industry Drivers and Constraints, Historical and Forecast Market Analysis by Segment:
|
| Breakup by Product Type |
|
| Breakup by Country |
|
| Market Dynamics |
|
| Competitive Landscape |
|
| Companies Covered |
|
Datasheet
One User
USD 2,499
USD 2,249
tax inclusive*
Single User License
One User
USD 3,999
USD 3,599
tax inclusive*
Five User License
Five User
USD 4,999
USD 4,249
tax inclusive*
Corporate License
Unlimited Users
USD 5,999
USD 5,099
tax inclusive*
*Please note that the prices mentioned below are starting prices for each bundle type. Kindly contact our team for further details.*
Flash Bundle
Small Business Bundle
Growth Bundle
Enterprise Bundle
*Please note that the prices mentioned below are starting prices for each bundle type. Kindly contact our team for further details.*
Flash Bundle
Number of Reports: 3
20%
tax inclusive*
Small Business Bundle
Number of Reports: 5
25%
tax inclusive*
Growth Bundle
Number of Reports: 8
30%
tax inclusive*
Enterprise Bundle
Number of Reports: 10
35%
tax inclusive*
How To Order

Select License Type
Choose the right license for your needs and access rights.

Click on ‘Buy Now’
Add the report to your cart with one click and proceed to register.

Select Mode of Payment
Choose a payment option for a secure checkout. You will be redirected accordingly.
Gain insights to stay ahead and seize opportunities.

Get insights & trends for a competitive edge.

Track prices with detailed trend reports.

Analyse trade data for supply chain insights.

Leverage cost reports for smart savings

Enhance supply chain with partnerships.

Connect For More Information
Our expert team of analysts will offer full support and resolve any queries regarding the report, before and after the purchase.
Our expert team of analysts will offer full support and resolve any queries regarding the report, before and after the purchase.
We employ meticulous research methods, blending advanced analytics and expert insights to deliver accurate, actionable industry intelligence, staying ahead of competitors.
Our skilled analysts offer unparalleled competitive advantage with detailed insights on current and emerging markets, ensuring your strategic edge.
We offer an in-depth yet simplified presentation of industry insights and analysis to meet your specific requirements effectively.


Share