

Consumer Insights
Uncover trends and behaviors shaping consumer choices today
Procurement Insights
Optimize your sourcing strategy with key market data
Industry Stats
Stay ahead with the latest trends and market analysis.

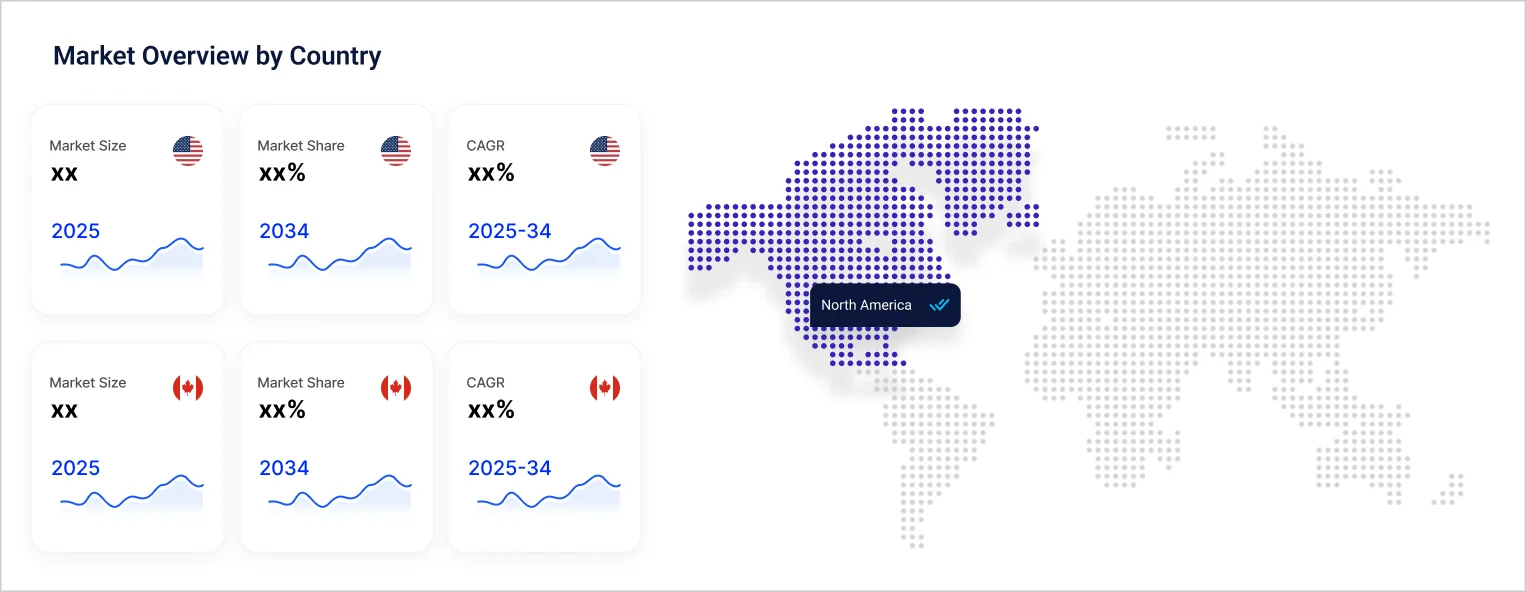
The North America copper market attained a volume of nearly 2142.25 KMT in 2025. The market is projected to grow at a CAGR of 2.40% between 2026 and 2035 to reach a value of around 2715.62 KMT by 2035.
Base Year
Historical Period
Forecast Period
Compound Annual Growth Rate
2.4%
Value in KMT
2026-2035
*this image is indicative*
Copper refers to a metallic element which possesses malleable and ductile properties. This element can be transformed into thin sheets and wires and is known to be an excellent conductor of electricity. With an atomic weight of 63.54 and atomic number 29, copper is reddish-brown in appearance.
The EMR’s report titled “North America Copper Market Report and Forecast 2026-2035” offers a detailed analysis of the market based on the following segments:
Market Breakup by Grade
Market Breakup by Form
Market Breakup by End Use
Market Breakup by Region
Oxygen-free copper contains very little oxygen content and is known to be more resistant to short circuit and has a higher durability as compared to its counterparts. The reduced oxygen content of the product enhances its resistance to corrosion. In this regard, oxygen-free copper is widely used in structural and thermal applications.
Meanwhile, electrolytic copper is a type of copper which has high tensile strength and excellent ductility, making it suitable for applications across various end-use sectors, including electronics, in North America.
Among different forms of copper, copper plates are one of the most useful materials, applied in several sectors across the United States and Canada. Copper plates have high malleability, corrosion resistance, lubricity, and anti-bacterial properties. Hence, they are ideal for utilisation in sectors such as marine, electrical and electronics, military, and HVAC, among others.
The comprehensive EMR report provides an in-depth assessment of the market based on the Porter's five forces model along with giving a SWOT analysis. The report gives a detailed analysis of the key players in the North America copper market report, covering their competitive landscape and latest developments like mergers, acquisitions, investments and expansion plans.
Electric Materials Company is a leading manufacturer of copper-related products, such as copper forgings, casting, and billets, among others. It was founded in 1915 and is headquartered in Pennsylvania, the United States.
Mitsubishi Materials Corporation is a prominent cement manufacturing company which also offers copper and aluminium products, along with electronic components. The company was established in 1871 and is headquartered in Tokyo, Japan.
Rio Tinto Group is a multinational company which is one of the largest metals and mining corporations. The company was founded in 1873 and is currently headquartered in London, the United Kingdom.
*Please note that this is only a partial list; the complete list of key players is available in the full report. Additionally, the list of key players can be customized to better suit your needs.*
Other market players include Freeport-McMoRan Inc., Capstone Copper Corp., Concast Metal Products Company, Montana Resources LLP, Newmont Corporation, and KGHM Polska Miedź S.A., among others.


Upto 15% Off
USD
$2499 $2249
$3999 $3599
$4999 $4249
$5999 $5099


*While we strive to always give you current and accurate information, the numbers depicted on the website are indicative and may differ from the actual numbers in the main report. At Expert Market Research, we aim to bring you the latest insights and trends in the market. Using our analyses and forecasts, stakeholders can understand the market dynamics, navigate challenges, and capitalize on opportunities to make data-driven strategic decisions.*
Get in touch with us for a customized solution tailored to your unique requirements and save upto 35%!
The market reached a value of nearly 2142.25 KMT in 2025.
The market is estimated to grow at a CAGR of 2.40% between 2026 and 2035.
The market is estimated to witness a healthy growth in the forecast period of 2026-2035 to reach a value of around 2715.62 KMT by 2035.
The rising demand for copper from the building and construction sector, the thriving manufacturing sector, and the heightening demand for copper in electrical wiring to meet the power requirement across the United States and Canada are the major drivers of the market.
The key trends in the market include technological advancements in the automotive sector and the rapid expansion of end-users of copper, such as the marine and HVAC sectors.
Pure coppers, oxygen-free coppers, electrolytic coppers, and free-machining coppers are the different forms of copper included in the market.
Wire rods, plates, sheet and strips, tube, and bars and sections, among others, are the major forms of copper considered in the market report.
Electric Materials Company, Mitsubishi Materials Corporation, Rio Tinto Group, Freeport-McMoRan Inc., Capstone Copper Corp., Concast Metal Products Company, Montana Resources LLP, Newmont Corporation, and KGHM Polska Miedz S.A., among others, are the key North America copper market players.
Explore our key highlights of the report and gain a concise overview of key findings, trends, and actionable insights that will empower your strategic decisions.
| REPORT FEATURES | DETAILS |
| Base Year | 2025 |
| Historical Period | 2019-2025 |
| Forecast Period | 2026-2035 |
| Scope of the Report |
Historical and Forecast Trends, Industry Drivers and Constraints, Historical and Forecast Market Analysis by Segment:
|
| Breakup by Grade |
|
| Breakup by Form |
|
| Breakup by End Use |
|
| Breakup by Region |
|
| Market Dynamics |
|
| Competitive Landscape |
|
| Companies Covered |
|
Datasheet
One User
USD 2,499
USD 2,249
tax inclusive*
Single User License
One User
USD 3,999
USD 3,599
tax inclusive*
Five User License
Five User
USD 4,999
USD 4,249
tax inclusive*
Corporate License
Unlimited Users
USD 5,999
USD 5,099
tax inclusive*
*Please note that the prices mentioned below are starting prices for each bundle type. Kindly contact our team for further details.*
Flash Bundle
Small Business Bundle
Growth Bundle
Enterprise Bundle
*Please note that the prices mentioned below are starting prices for each bundle type. Kindly contact our team for further details.*
Flash Bundle
Number of Reports: 3
20%
tax inclusive*
Small Business Bundle
Number of Reports: 5
25%
tax inclusive*
Growth Bundle
Number of Reports: 8
30%
tax inclusive*
Enterprise Bundle
Number of Reports: 10
35%
tax inclusive*
How To Order

Select License Type
Choose the right license for your needs and access rights.

Click on ‘Buy Now’
Add the report to your cart with one click and proceed to register.

Select Mode of Payment
Choose a payment option for a secure checkout. You will be redirected accordingly.
Gain insights to stay ahead and seize opportunities.

Get insights & trends for a competitive edge.

Track prices with detailed trend reports.

Analyse trade data for supply chain insights.

Leverage cost reports for smart savings

Enhance supply chain with partnerships.

Connect For More Information
Our expert team of analysts will offer full support and resolve any queries regarding the report, before and after the purchase.
Our expert team of analysts will offer full support and resolve any queries regarding the report, before and after the purchase.
We employ meticulous research methods, blending advanced analytics and expert insights to deliver accurate, actionable industry intelligence, staying ahead of competitors.
Our skilled analysts offer unparalleled competitive advantage with detailed insights on current and emerging markets, ensuring your strategic edge.
We offer an in-depth yet simplified presentation of industry insights and analysis to meet your specific requirements effectively.


Share