

Consumer Insights
Uncover trends and behaviors shaping consumer choices today
Procurement Insights
Optimize your sourcing strategy with key market data
Industry Stats
Stay ahead with the latest trends and market analysis.

The North America cider market reached approximately USD 1.35 Billion in 2025. The market is projected to grow at a CAGR of 3.50% between 2026 and 2035, reaching a value of around USD 1.90 Billion by 2035.
Base Year
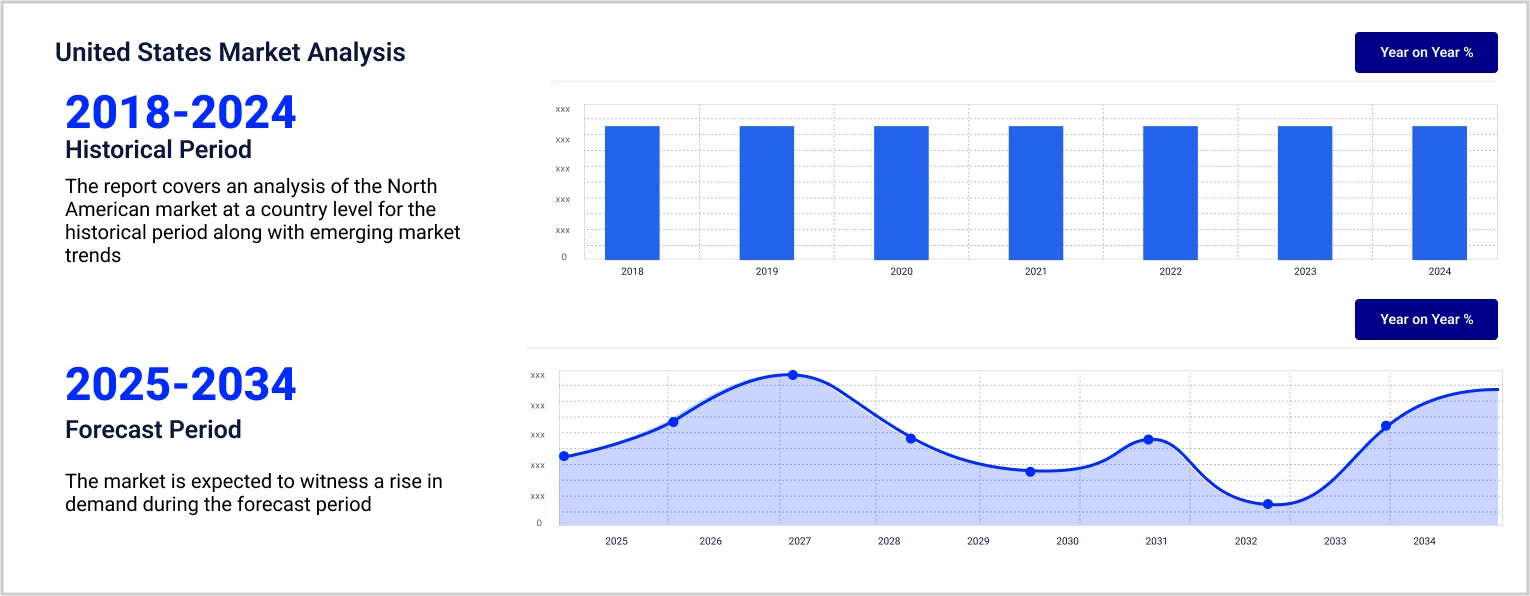
Historical Period
Forecast Period
Based on the 2022 NSDUH findings, 215.6 million individuals aged 18 and above (equivalent to 84.1% in the US) stated that they have consumed alcohol at least once in their lives.
The apple harvest in the United States for 2021 amounted to slightly more than 10.5 billion pounds.
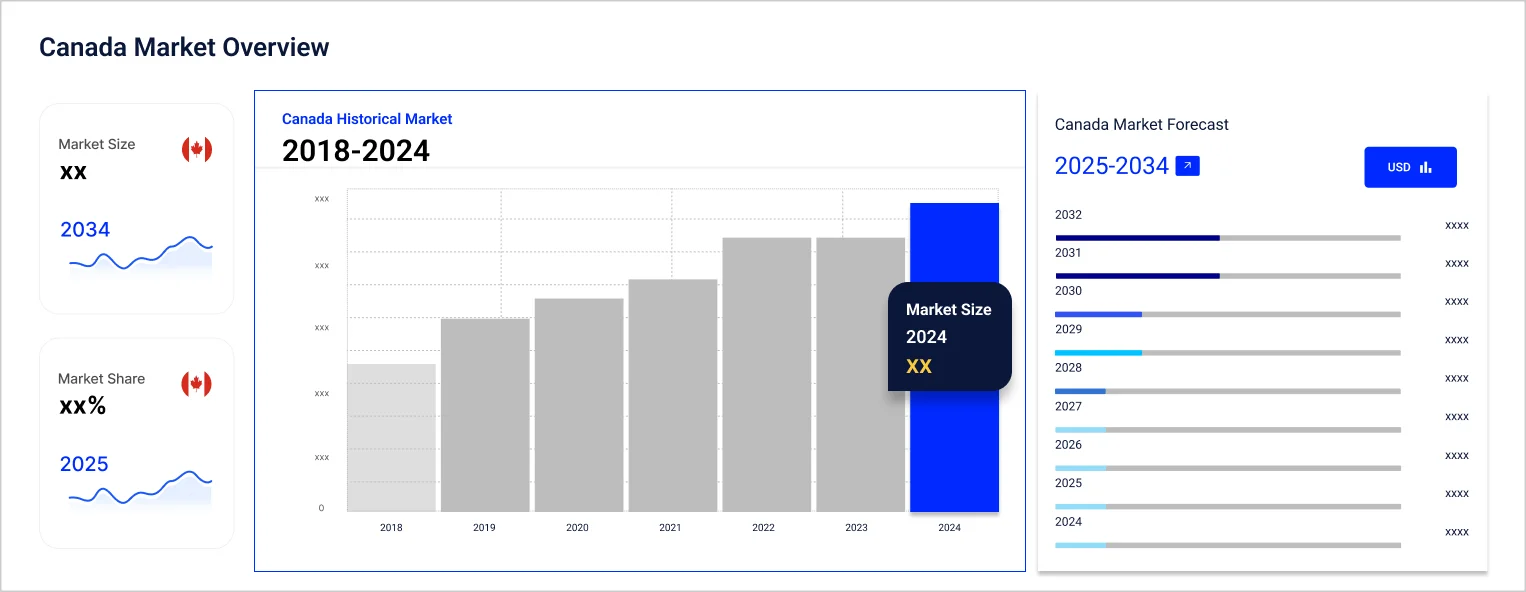
During the fiscal year 2020-21, the government of Canada generated a total revenue of $12.4 billion from the sale of alcoholic beverages.
Compound Annual Growth Rate
3.5%
Value in USD Billion
2026-2035
*this image is indicative*
| North America Cider Market Report Summary | Description | Value |
| Base Year | USD Billion | 2025 |
| Historical Period | USD Billion | 2019-2025 |
| Forecast Period | USD Billion | 2026-2035 |
| Market Size 2025 | USD Billion | 1.35 |
| Market Size 2035 | USD Billion | 1.90 |
| CAGR 2019-2025 | Percentage | XX% |
| CAGR 2026-2035 | Percentage | 3.50% |
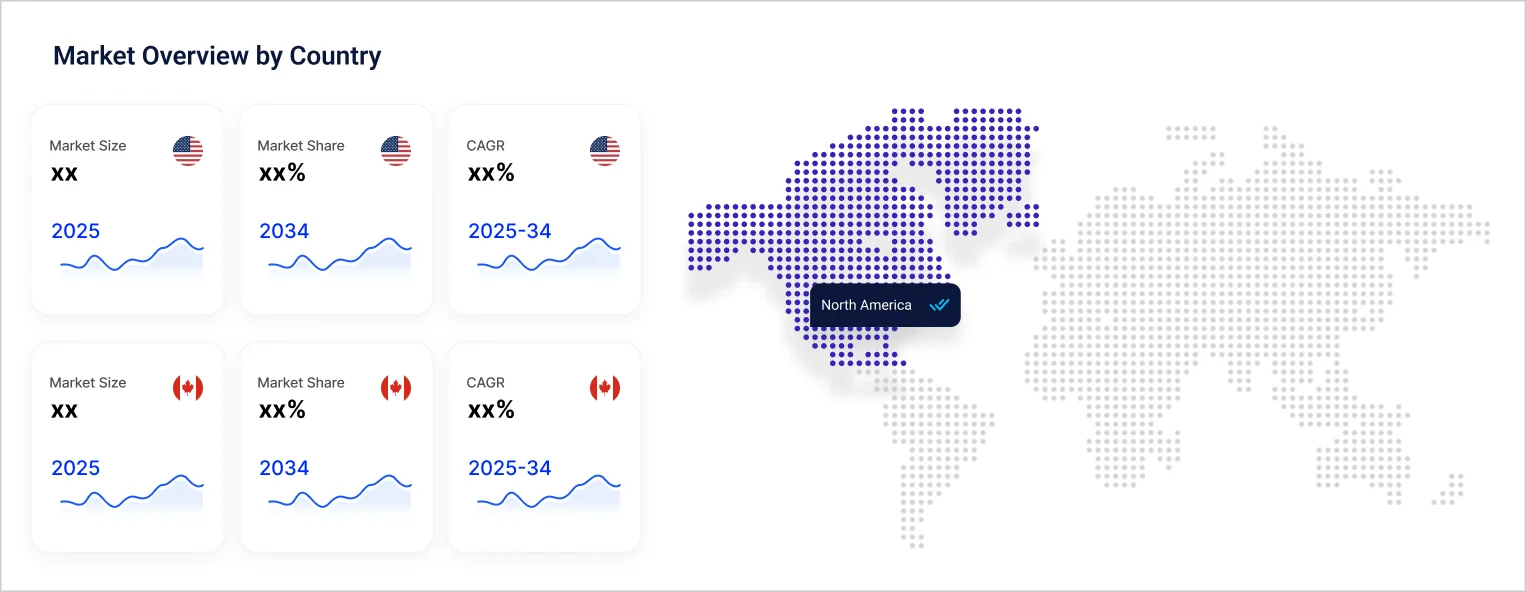
| CAGR 2026-2035 - Market by Country | United States | 3.4% |
| CAGR 2026-2035 - Market by Type | Flavoured | 3.9% |
| CAGR 2026-2035 - Market by Packaging | Cans | 4.0% |
| 2025 Market Share by Country | Canada | 9.6% |
Apples are the most widely consumed fruit in the United States, with 32 states engaging in commercial apple cultivation. According to the U.S. Apple Association in 2021, the top ten apple-producing states include Washington, New York, Michigan, Pennsylvania, California, Virginia, North Carolina, Oregon, Ohio, and Idaho. In 2019, the average per capita consumption of apple juice and cider was 12.6 pounds. The United States ranks as the second-largest apple producer globally, following China. The United States boasts around 200 distinct apple varieties, with the top 10 varieties being Red Delicious, Gala, Granny Smith, Fuji, Golden Delicious, Honey Crisp, McIntosh, Rome, Cripps Pink/Pink Lady, and Empire.
The use of organic apples for cider production has been gaining popularity due to various factors related to consumer preferences, environmental benefits, and perceived quality. Many consumers are increasingly concerned about the health implications of synthetic chemicals and pesticides used in conventional agriculture. Organic apples are grown without synthetic pesticides and fertilisers, making them appealing to health-conscious consumers.
According to the 2019 USDA Certified Organic Summary, an estimated 657 farms in the United States produced 831 million pounds of certified organic apples in 2019 with a sales value of $451.2 million. Washington state remains the top producer of organic apples, yielding 806 million pounds, with an estimated crop value of $433 million.
“North America Cider Market Report and Forecast 2026-2035” offers a detailed analysis of the market based on the following segments:
Market Breakup by Type
Market Breakup by Packaging
Market Breakup by Distribution Channel
Market Breakup by Country
| CAGR 2026-2035 - Market by | Type |
| Flavoured | 3.9% |
| Plain | XX% |
| CAGR 2026-2035 - Market by | Packaging |
| Cans | 4.0% |
| Glass Bottles | 3.7% |
| Draught | XX% |
| Plastic Bottles | XX% |
| Others | XX% |
| CAGR 2026-2035 - Market by | Country |
| United States | 3.4% |
| Canada | XX% |
Based on the type, the market is segmented into flavoured and plain. The flavoured segment is projected to grow at a CAGR of 3.9% during the forecast period of 2026-2035.The surge in popularity of flavoured cider can be attributed to a combination of changing consumer preferences, the influence of the craft beverage movement, advancements in production techniques, effective marketing strategies, and a focus on health-conscious choices.
| 2025 Market Share by | Country |
| Canada | 9.6% |
| United States | XX% |
Major players are focusing on the expansion of new product offerings and flavour innovation to gain a competitive edge in the market.


Upto 15% Off
USD
$3999 $3599
$2499 $2249
$4999 $4249
$5999 $5099


*While we strive to always give you current and accurate information, the numbers depicted on the website are indicative and may differ from the actual numbers in the main report. At Expert Market Research, we aim to bring you the latest insights and trends in the market. Using our analyses and forecasts, stakeholders can understand the market dynamics, navigate challenges, and capitalize on opportunities to make data-driven strategic decisions.*
Get in touch with us for a customized solution tailored to your unique requirements and save upto 35%!
In 2025, the market reached an approximate value of USD 1.35 Billion.
The market is estimated to grow at a CAGR of 3.50% between 2026 and 2035.
The market is estimated to witness a healthy growth during 2026-2035 to reach around USD 1.90 Billion by 2035.
The market is being driven by growing apple production in the region and the growing popularity of craft ciders.
The key trends aiding the market expansion include the rise in cider tourism and the growing adoption of ethical sourcing practices.
The major countries considered in the market are the United States and Canada.
The different distribution channels of cider include on-trade and off-trade.
The major players in the market are Heineken N.V., Carlsberg Group, ANHEUSER-BUSCH INBEV SA/NV, Asahi Group Holdings, Ltd., C & C Group plc, Molson Coors Beverage Company, Boston Beer Corporation, Angry Orchard Cider Company, LLC, Blake’s Family of Companies, and Austin Eastciders, Inc., among others.
Explore our key highlights of the report and gain a concise overview of key findings, trends, and actionable insights that will empower your strategic decisions.
| REPORT FEATURES | DETAILS |
| Base Year | 2025 |
| Historical Period | 2019-2025 |
| Forecast Period | 2026-2035 |
| Scope of the Report |
Historical and Forecast Trends, Industry Drivers and Constraints, Historical and Forecast Market Analysis by Segment:
|
| Breakup by Type |
|
| Breakup by Packaging |
|
| Breakup by Distribution Channel |
|
| Breakup by Country |
|
| Market Dynamics |
|
| Competitive Landscape |
|
| Companies Covered |
|
Single User License
One User
USD 3,999
USD 3,599
tax inclusive*
Datasheet
One User
USD 2,499
USD 2,249
tax inclusive*
Five User License
Five User
USD 4,999
USD 4,249
tax inclusive*
Corporate License
Unlimited Users
USD 5,999
USD 5,099
tax inclusive*
*Please note that the prices mentioned below are starting prices for each bundle type. Kindly contact our team for further details.*
Flash Bundle
Small Business Bundle
Growth Bundle
Enterprise Bundle
*Please note that the prices mentioned below are starting prices for each bundle type. Kindly contact our team for further details.*
Flash Bundle
Number of Reports: 3
20%
tax inclusive*
Small Business Bundle
Number of Reports: 5
25%
tax inclusive*
Growth Bundle
Number of Reports: 8
30%
tax inclusive*
Enterprise Bundle
Number of Reports: 10
35%
tax inclusive*
How To Order

Select License Type
Choose the right license for your needs and access rights.

Click on ‘Buy Now’
Add the report to your cart with one click and proceed to register.

Select Mode of Payment
Choose a payment option for a secure checkout. You will be redirected accordingly.
Gain insights to stay ahead and seize opportunities.

Get insights & trends for a competitive edge.

Track prices with detailed trend reports.

Analyse trade data for supply chain insights.

Leverage cost reports for smart savings

Enhance supply chain with partnerships.

Connect For More Information
Our expert team of analysts will offer full support and resolve any queries regarding the report, before and after the purchase.
Our expert team of analysts will offer full support and resolve any queries regarding the report, before and after the purchase.
We employ meticulous research methods, blending advanced analytics and expert insights to deliver accurate, actionable industry intelligence, staying ahead of competitors.
Our skilled analysts offer unparalleled competitive advantage with detailed insights on current and emerging markets, ensuring your strategic edge.
We offer an in-depth yet simplified presentation of industry insights and analysis to meet your specific requirements effectively.


Share