

Consumer Insights
Uncover trends and behaviors shaping consumer choices today
Procurement Insights
Optimize your sourcing strategy with key market data
Industry Stats
Stay ahead with the latest trends and market analysis.

The North America automated demand responses management market size is projected to grow at a CAGR of 24.50% between 2026 and 2035. The market is being driven by the growing adoption of renewable energy sources and the rising focus on optimising energy consumption.
Base Year
Historical Period
Forecast Period
As per the Canada Green Building Council, buildings account for 30% of the total greenhouse gas emissions.
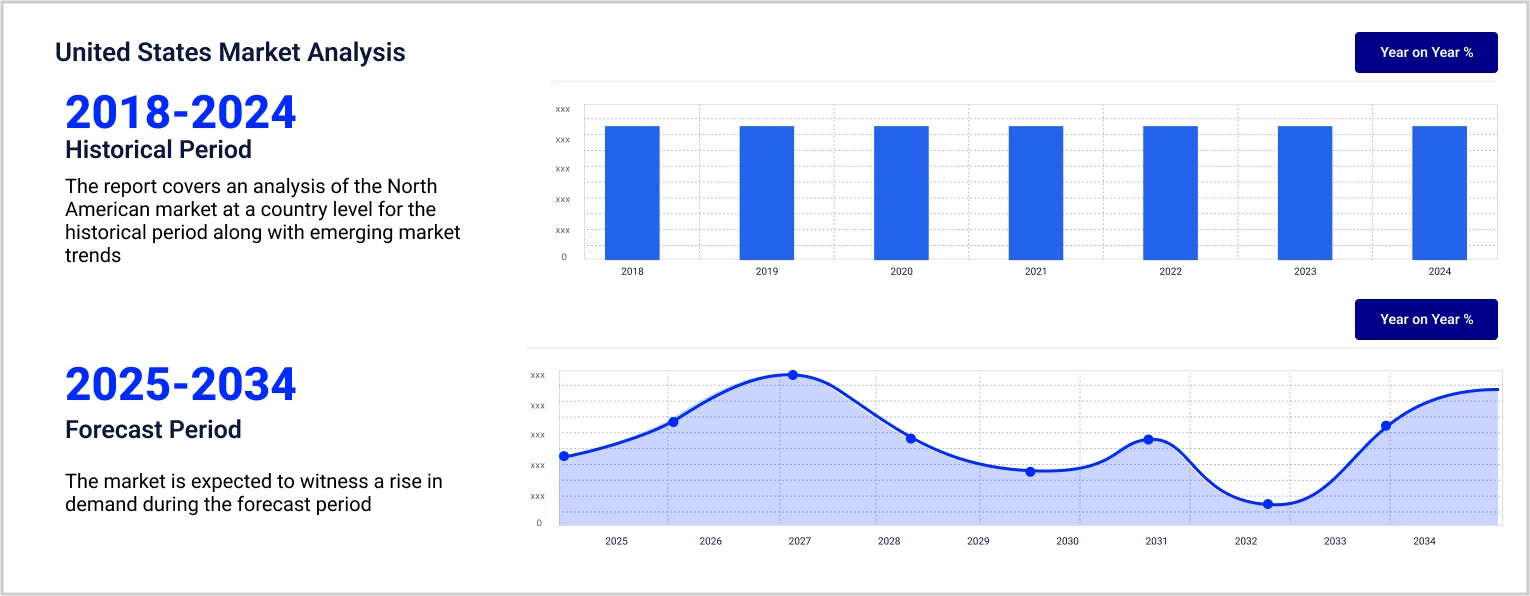
Retail electricity prices surged by 2.5% y-o-y in 2022 in the USA, which is expected to favour the market.
The US government has invested $61 million in retrofitting buildings, which can contribute to market growth.
Compound Annual Growth Rate
24.5%
2026-2035
*this image is indicative*
Automated demand response (ADR) management systems are designed to minimise energy consumption during peak demand periods by relying on automated technologies. This enables commercial property owners to reduce their carbon footprint and save money on electricity bills. By utilising real-time information from energy meters and building control systems, ADR systems can automatically modify the settings of HVAC and lighting systems in unused areas to prevent energy wastage.
The market is being driven by technological developments in the power sector, rising electricity consumption, and the shift towards sustainability. During peak hours, electrical grids bear an overwhelming surge in electricity demand, which necessitates the need for an ADR system to prevent wasteful consumption and still meet consumer demand.
Extreme climatic conditions are leading to an increase in the consumption of energy from non-renewable sources, which is prompting a consumer shift towards renewable sources. This is expected to lead to the North America automated demand responses management market growth in the forecast period.
Rising electricity costs; increase in usage of Distributed Energy Resources (DERs); rise in construction of smart buildings; and a surge in consumer participation are the major trends impacting the market growth.
In 2023, the monthly electricity bill paid by an average American household was $133, an increase of 5% from 2022
As consumers switch towards solar panels, battery storage systems, and other sources of energy, the need for integrating ADR systems can become increasingly important for ensuring efficient usage.
In October 2021, the United States government invested $61 million into the construction of smart buildings to promote grid resilience and renewable sources of energy.
Many energy companies are expected to incentivise consumers who reduce their electricity consumption and contribute towards stabilising the demand-supply gap during peak hours.
The monthly consumption of electricity in the United States rose from 886 kWh to 907 kWh between 2021 and 2022. This was due to an increase in cooling and heating requirements during the hot and cold weather, respectively. ADR management systems can prevent the excessive utilisation of electricity when not required and contribute to the energy efficiency of buildings. In the USA, the prices of residential retail electricity increased from 13.66 cents/kWh to 15.12 cents/kWh between 2021 and 2022. This trend is likely to sustain and impact the North America automated demand responses management market development favourably in the coming years.
The investment of $61 million is focused on creating connected communities, in which mechanical devices, including HVAC systems and lighting bulbs, can interact with the electrical grid to conserve energy and decarbonise the construction sector. The beneficiaries of this funding include IBACOS, Inc. (NC), Electric Power Research Institute, Inc., and Portland General Electric, among others.
“North America Automated Demand Responses Management Market Report and Forecast 2026-2035” offers a detailed analysis of the market based on the following segments:
Market Breakup by Service
Market Breakup by End User
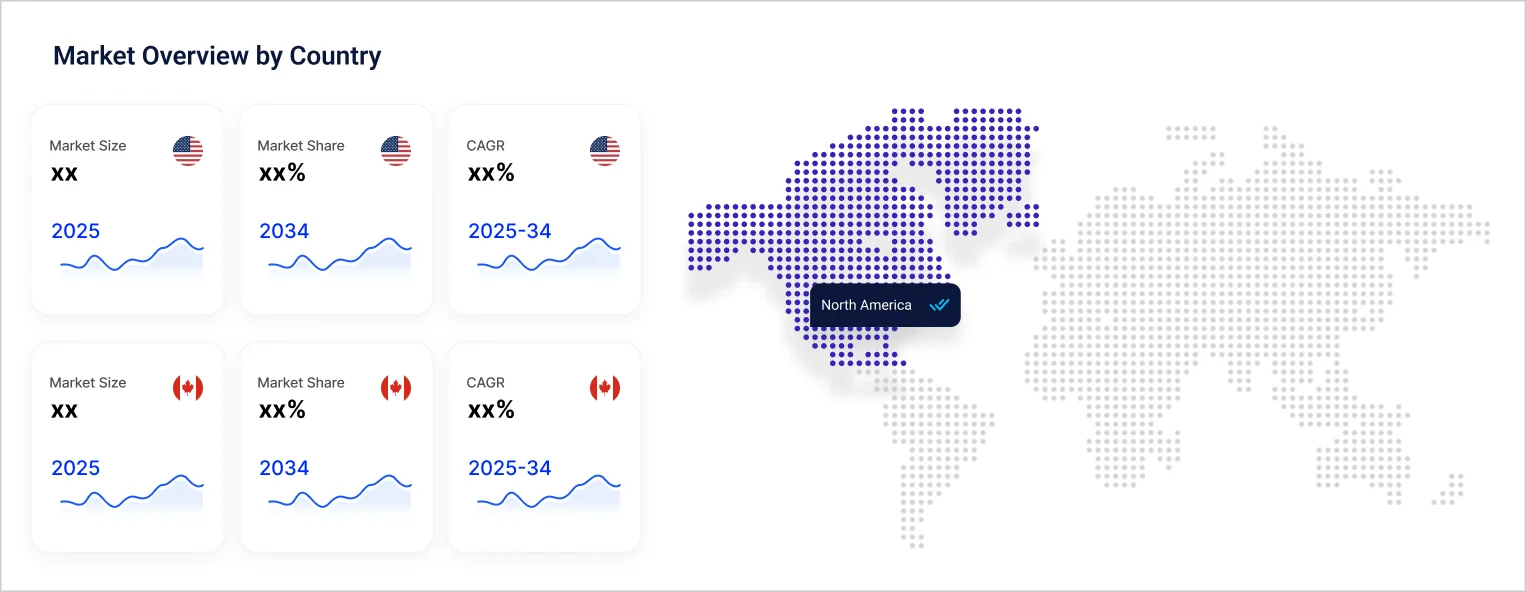
Market Breakup by Region
Commercial and public buildings are expected to constitute a significant portion of the North America automated demand responses management market share
Commercial and public buildings represent a major market share. This can be attributed to the introduction of government regulations to promote the energy efficiency of buildings and increasing investments in the sector for retrofitting existing residential houses and projects. With increasing innovations in the product offerings of energy and power companies, it is expected that the market will witness significant growth in the coming years.
Major players in the North America automated demand responses management market are researching upcoming technologies to boost the potential of innovative ADR management systems.
| Company | Year Incorporated | Location | Industry | Services |
| Honeywell International Inc. | 1999 | North Carolina, United States | Aerospace, construction, and chemical manufacturing | Providing services and software solutions |
| Siemens AG | 1847 | Munich, Germany | Healthcare, transportation, and infrastructure development | Providing technological solutions and financial services |
| Eaton Corporation plc | 1911 | Dublin, Ireland | Hydraulic, aerospace, electrical, and vehicle components | Manufacturing and related products and services |
| Itron Inc. | 1977 | Washington, USA | Infrastructure solutions for smart cities and buildings | Providing critical infrastructure solutions across 100 countries |
Other key players in the North America automated demand responses management market include Autogrid Systems, Inc., Johnson Controls International plc, Hubbell Incorporated, and Open Access Technology International, Inc., among others.
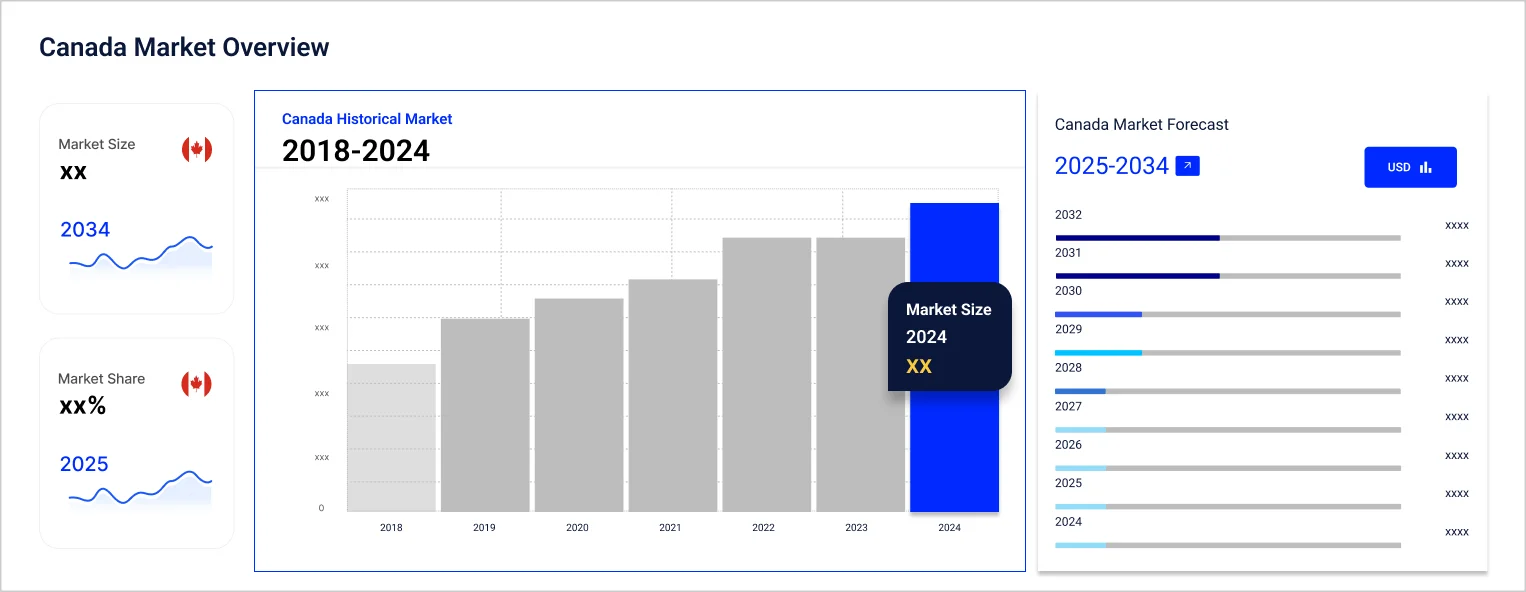
Canada is expected to dominate the market in the forecast period. This is because of increasing government investments aimed at retrofitting millions of commercial, institutional, and residential buildings in Canada through the Greener Neighborhoods Pilot Program and the Deep Retrofit Accelerator Initiative.
In September 2023, ABB Canada, a technology company, signed a deal with Canada’s export credit agency EDC to drive consumer awareness regarding clean technologies and boost their adoption through a $2.9 million funding support. Retrofitting projects currently being undertaken by Canadian universities, including McMaster University, are expected to drive the North America automated demand responses management market progress.
Meanwhile, the market in the US is expected to grow rapidly in the forecast period due to the increasing electricity prices in the country.


Upto 15% Off
USD
$2499 $2249
$3999 $3599
$4999 $4249
$5999 $5099


*While we strive to always give you current and accurate information, the numbers depicted on the website are indicative and may differ from the actual numbers in the main report. At Expert Market Research, we aim to bring you the latest insights and trends in the market. Using our analyses and forecasts, stakeholders can understand the market dynamics, navigate challenges, and capitalize on opportunities to make data-driven strategic decisions.*
Get in touch with us for a customized solution tailored to your unique requirements and save upto 35%!
The market is estimated to grow at a CAGR of 24.50% between 2026 and 2035.
The market is being driven by technological developments in construction automation, rising electricity consumption, and the shift towards sustainability.
The key trends aiding the market expansion include rising electricity costs, an increase in the usage of Distributed Energy Resources (DERs); and an increase in the construction of smart buildings.
Curtailment services, system integration and consulting services, managed services, and support and maintenance services are the different services offered by automated demand reponses management.
The major applications of automated demand responses management systems include manufacturing, commercial building, agriculture, energy and power, and public buildings.
The major countries include the United States of America and Canada.
The major players in the market are Honeywell International Inc., Siemens AG, Autogrid Systems, Inc., Eaton Corporation plc, Johnson Controls International plc, Itron Inc., Hubbell Incorporated, and Open Access Technology International, Inc., among others.
Explore our key highlights of the report and gain a concise overview of key findings, trends, and actionable insights that will empower your strategic decisions.
| REPORT FEATURES | DETAILS |
| Base Year | 2025 |
| Historical Period | 2019-2025 |
| Forecast Period | 2026-2035 |
| Scope of the Report |
Historical and Forecast Trends, Industry Drivers and Constraints, Historical and Forecast Market Analysis by Segment:
|
| Breakup by Service |
|
| Breakup by End User |
|
| Breakup by Region |
|
| Market Dynamics |
|
| Competitive Landscape |
|
| Companies Covered |
|
Datasheet
One User
USD 2,499
USD 2,249
tax inclusive*
Single User License
One User
USD 3,999
USD 3,599
tax inclusive*
Five User License
Five User
USD 4,999
USD 4,249
tax inclusive*
Corporate License
Unlimited Users
USD 5,999
USD 5,099
tax inclusive*
*Please note that the prices mentioned below are starting prices for each bundle type. Kindly contact our team for further details.*
Flash Bundle
Small Business Bundle
Growth Bundle
Enterprise Bundle
*Please note that the prices mentioned below are starting prices for each bundle type. Kindly contact our team for further details.*
Flash Bundle
Number of Reports: 3
20%
tax inclusive*
Small Business Bundle
Number of Reports: 5
25%
tax inclusive*
Growth Bundle
Number of Reports: 8
30%
tax inclusive*
Enterprise Bundle
Number of Reports: 10
35%
tax inclusive*
How To Order

Select License Type
Choose the right license for your needs and access rights.

Click on ‘Buy Now’
Add the report to your cart with one click and proceed to register.

Select Mode of Payment
Choose a payment option for a secure checkout. You will be redirected accordingly.
Gain insights to stay ahead and seize opportunities.

Get insights & trends for a competitive edge.

Track prices with detailed trend reports.

Analyse trade data for supply chain insights.

Leverage cost reports for smart savings

Enhance supply chain with partnerships.

Connect For More Information
Our expert team of analysts will offer full support and resolve any queries regarding the report, before and after the purchase.
Our expert team of analysts will offer full support and resolve any queries regarding the report, before and after the purchase.
We employ meticulous research methods, blending advanced analytics and expert insights to deliver accurate, actionable industry intelligence, staying ahead of competitors.
Our skilled analysts offer unparalleled competitive advantage with detailed insights on current and emerging markets, ensuring your strategic edge.
We offer an in-depth yet simplified presentation of industry insights and analysis to meet your specific requirements effectively.


Share