

Consumer Insights
Uncover trends and behaviors shaping consumer choices today
Procurement Insights
Optimize your sourcing strategy with key market data
Industry Stats
Stay ahead with the latest trends and market analysis.

The North America application container market size reached approximately USD 2.13 Billion in 2025. The market is projected to grow at a CAGR of 23.30% between 2026 and 2035, reaching a value of around USD 17.30 Billion by 2035.
Base Year
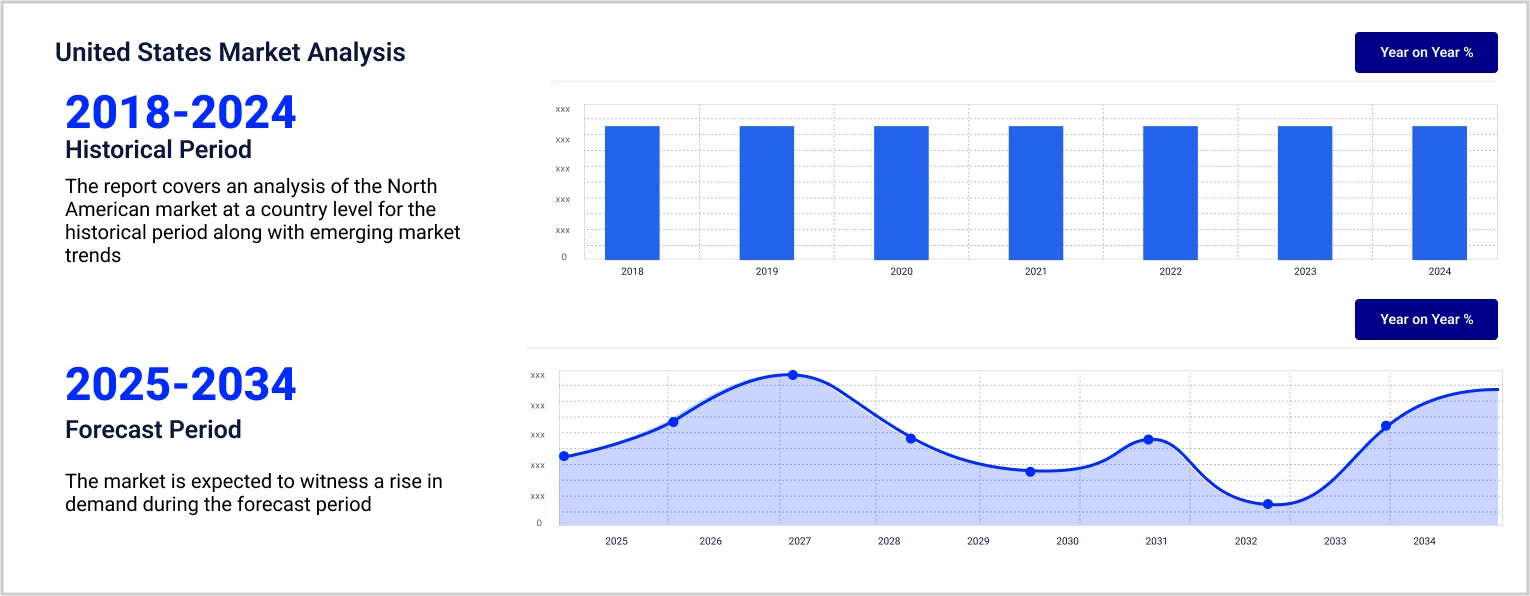
Historical Period
Forecast Period
Reportedly, over 90% of organisations are expected to run containerised applications in production by 2027.
Containerised applications play a pivotal role in enhancing IT operational efficiency, digital transformation, and cloud migration.
The technology sector maintains its position as the leading adopter of application containers and is poised to dominate the market.
Compound Annual Growth Rate
23.3%
Value in USD Billion
2026-2035
*this image is indicative*
Application container refers to a virtualisation app that offers an isolated environment to build, deploy, and manage applications across different environments. It utilises fewer resources compared to standard virtual machines (VM) and offers higher security through the isolation of applications and rapid deployment of apps to other platforms.
The growing usage of Kubernetes in application containerisation for the automation, deployment, and scaling of applications in containers and ensuring their seamless operation is one of the major factors driving the North America application container market growth. This open-source platform can automate routine tasks, reduce manual errors during deployment, and allow the DevOps (development and operation) team to focus on other important tasks.
The North America application container market growth is being driven by the deployment of application containers in a hybrid cloud; rising focus on boosting container platform security; the rising popularity of CaaS; and advancements in containerisation technology
Enterprises are leveraging application containers in hybrid cloud environments for the smooth transfer of workload between the on-premises and cloud ecosystems.
Container as a service (CaaS) is increasingly gaining popularity as it offers enhanced scalability, provides enhanced security and scalability, enables users to pay for resources used, and eliminates the need to test container infrastructure and build clusters.
As container environments require continuous monitoring and are highly dynamic, there is a rising adoption of security measures to mitigate risks, enhance vulnerability management, and secure containers.
Advancements in containerisation technology aimed at reducing infrastructural costs, enhancing scalability, and driving application security are expected to aid the North America application container market expansion.
The rising popularity of container as a service (CaaS), which is a cloud-based platform that simplifies containerised applications so the developers can focus on the deployment of code, also offers support to the North America application container market demand. It offers a pay-as-you-go price model in which organisations only pay for the resources they consume and save the overhead cost.
Increased efforts by market players to enhance the security of container platforms is another crucial trend aiding the market expansion. For example, in May 2022, Docker Inc., a US-based cloud service provider, acquired Nestybox, a company that offers enhanced isolation for containers, to strengthen and develop new security capabilities for application containers.
“North America Application Container Market Report and Forecast 2026-2035” offers a detailed analysis of the market based on the following segments:
Market Breakup by Deployment Mode
Market Breakup by Service
Market Breakup by Organisation Size
Market Division by Industry Vertical
Market Breakup by Region
Data management and orchestration services represent a significant market share
Data management and orchestration services occupy a significant portion of the North America application container market share as application containers facilitate the quick deployment and management of data compared to traditional VMs. The growing presence of market players in the region that are readily adopting innovative technologies to improve the effectiveness of containers also supports the segment’s growth.
Monitoring and security services are also anticipated to witness robust growth in the coming years as the containers can detect errors and allow the enterprise to fix them in the containerised environment quickly.
Containerisation is revolutionising the BFSI sector as it offers a secure and cost-effective environment for application management
As per the North America application container market analysis, the BFSI sector accounts for a healthy market share as it offers an economical and secure environment for the management of applications that may contain sensitive information. The growing adoption of cloud services in the banking sector, due to their scalability, also offers lucrative opportunities for application containers.
The IT and telecom sector is also expected to gain sizeable growth in the forecast period, due to the growing use of containers for agile application deployment. Meanwhile, with rapid digital transformation and technological advancements in the healthcare and life sciences sector, containerised applications can reduce licensing and server costs, promote agility and flexibility, facilitate automation, and reduce costs.
Some of the major players included in the North America application container market report are engaging in merger and acquisition activities to enhance their capabilities:
Oracle Corp., incorporated in 1977 and based in Texas, the United States, is a multinational technology company. Some of its major products and services include Oracle cloud infrastructure, Oracle cloud applications, and Oracle database, among others.
Microsoft Corp. is a computer technology company, established in 1975 and based in New Mexico, the United States. Some of its renowned products include Microsoft Office, Microsoft operating system, Microsoft Azure, and Xbox, among others.
Hewlett Packard Enterprise Development LP, founded in 1939, is an information technology corporation, based in Texas, the United States. The company offers the deployment of new container-based applications as well as the modernisation of preexisting applications through its container solutions.
Docker Inc. is a company that supports developers to collaboratively and efficiently run, build, and share applications. Headquartered in California, the US, the company is known for offering reliable, integrated, and secure workflow to support app delivery.
*Please note that this is only a partial list; the complete list of key players is available in the full report. Additionally, the list of key players can be customized to better suit your needs.*
Other North America application container market players include Amazon Web Services, Inc., Alphabet Inc., IBM Corp. (Red Hat, Inc.), Broadcom Inc., Salesforce, Inc., and Telefonaktiebolaget LM Ericsson, among others.
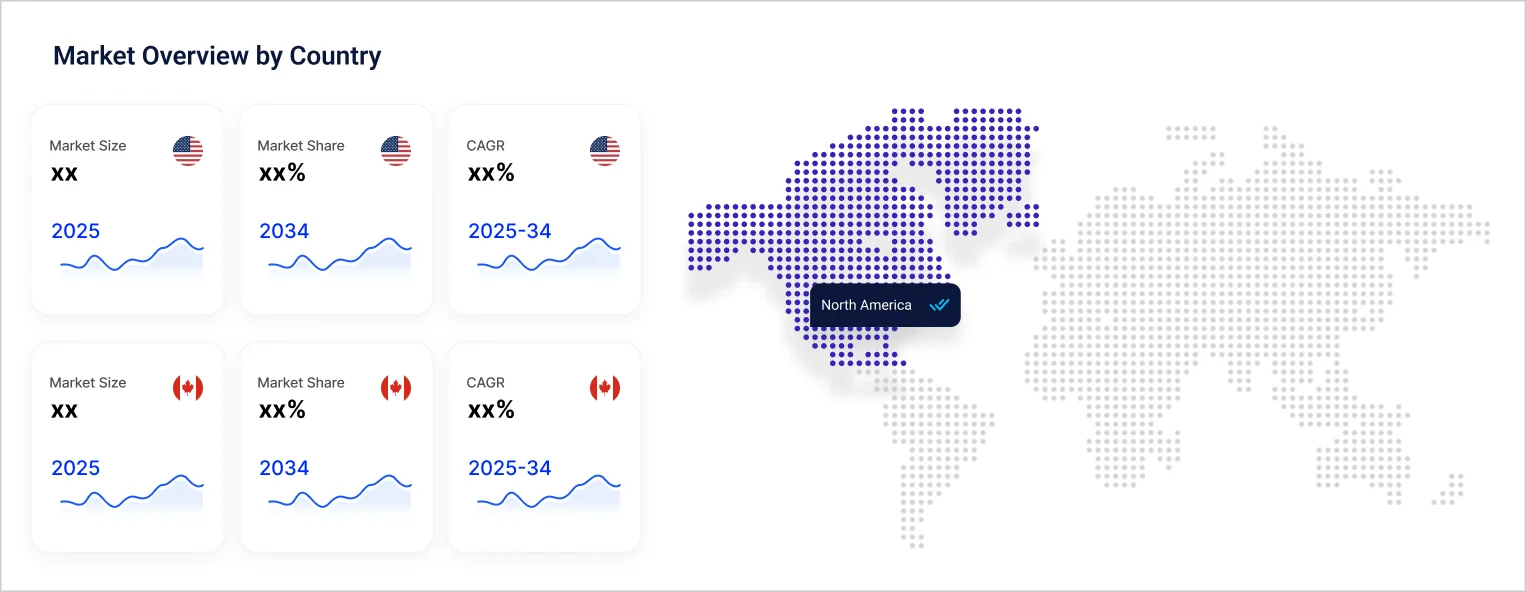
The United States represents a significant portion of the North America application container market share due to the presence of leading companies such as Microsoft, Salesforce, and Oracle, among others, in the country. Due to the high proliferation of tech start-ups and countries in the country, application containers that can reduce the time and cost spent on infrastructure maintenance are rising.
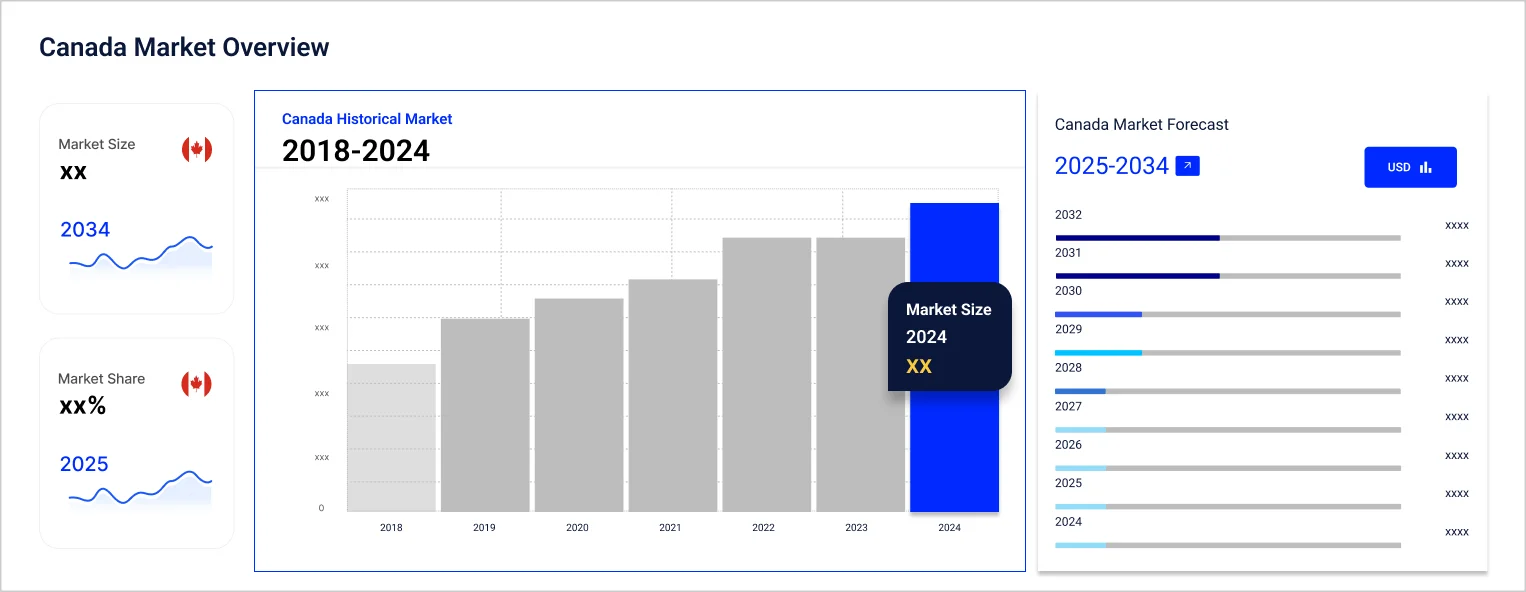
In the forecast period, increasing adoption of application container platforms in sectors like healthcare and BFSI is expected to favour the US market expansion. Meanwhile, the adoption of application containers in Canada is anticipated to rise in the coming years as it can enhance business outcomes and combat challenges associated with traditional application development.


Upto 15% Off
USD
$2499 $2249
$3999 $3599
$4999 $4249
$5999 $5099


*While we strive to always give you current and accurate information, the numbers depicted on the website are indicative and may differ from the actual numbers in the main report. At Expert Market Research, we aim to bring you the latest insights and trends in the market. Using our analyses and forecasts, stakeholders can understand the market dynamics, navigate challenges, and capitalize on opportunities to make data-driven strategic decisions.*
Get in touch with us for a customized solution tailored to your unique requirements and save upto 35%!
In 2025, the market reached an approximate value of USD 2.13 Billion.
The market is estimated to grow at a CAGR of 23.30% between 2026 and 2035.
The market is estimated to witness a healthy growth during 2026-2035 to reach around USD 17.30 Billion by 2035.
The market is being driven by the increasing utilisation of application containers in hybrid cloud environments and growing usage of Kubernetes in application containerization.
The key trends aiding the market expansion include growing usage of Kubernetes in application containerisation, rising popularity of container as a service (CaaS), and increasing efforts by market players to enhance the security of container platforms.
The major regional markets are the United States of America and Canada.
The different industry verticals of application container are BFSI, IT and telecom, healthcare and life science, retail and e-commerce, and media and entertainment, among others.
The major players in the market are Amazon Web Services, Inc., Oracle Corp., Microsoft Corp., Alphabet Inc., IBM Corp. (Red Hat, Inc.), Hewlett Packard Enterprise Development LP, Broadcom Inc., Salesforce, Inc., Telefonaktiebolaget LM Ericsson, and Docker Inc., among others.
Explore our key highlights of the report and gain a concise overview of key findings, trends, and actionable insights that will empower your strategic decisions.
| REPORT FEATURES | DETAILS |
| Base Year | 2025 |
| Historical Period | 2019-2025 |
| Forecast Period | 2026-2035 |
| Scope of the Report |
Historical and Forecast Trends, Industry Drivers and Constraints, Historical and Forecast Market Analysis by Segment:
|
| Breakup by Deployment Mode |
|
| Breakup by Service |
|
| Breakup by Organisation Size |
|
| Breakup by Industry Vertical |
|
| Breakup by Region |
|
| Market Dynamics |
|
| Competitive Landscape |
|
| Companies Covered |
|
Datasheet
One User
USD 2,499
USD 2,249
tax inclusive*
Single User License
One User
USD 3,999
USD 3,599
tax inclusive*
Five User License
Five User
USD 4,999
USD 4,249
tax inclusive*
Corporate License
Unlimited Users
USD 5,999
USD 5,099
tax inclusive*
*Please note that the prices mentioned below are starting prices for each bundle type. Kindly contact our team for further details.*
Flash Bundle
Small Business Bundle
Growth Bundle
Enterprise Bundle
*Please note that the prices mentioned below are starting prices for each bundle type. Kindly contact our team for further details.*
Flash Bundle
Number of Reports: 3
20%
tax inclusive*
Small Business Bundle
Number of Reports: 5
25%
tax inclusive*
Growth Bundle
Number of Reports: 8
30%
tax inclusive*
Enterprise Bundle
Number of Reports: 10
35%
tax inclusive*
How To Order

Select License Type
Choose the right license for your needs and access rights.

Click on ‘Buy Now’
Add the report to your cart with one click and proceed to register.

Select Mode of Payment
Choose a payment option for a secure checkout. You will be redirected accordingly.
Gain insights to stay ahead and seize opportunities.

Get insights & trends for a competitive edge.

Track prices with detailed trend reports.

Analyse trade data for supply chain insights.

Leverage cost reports for smart savings

Enhance supply chain with partnerships.

Connect For More Information
Our expert team of analysts will offer full support and resolve any queries regarding the report, before and after the purchase.
Our expert team of analysts will offer full support and resolve any queries regarding the report, before and after the purchase.
We employ meticulous research methods, blending advanced analytics and expert insights to deliver accurate, actionable industry intelligence, staying ahead of competitors.
Our skilled analysts offer unparalleled competitive advantage with detailed insights on current and emerging markets, ensuring your strategic edge.
We offer an in-depth yet simplified presentation of industry insights and analysis to meet your specific requirements effectively.


Share