

Consumer Insights
Uncover trends and behaviors shaping consumer choices today
Procurement Insights
Optimize your sourcing strategy with key market data
Industry Stats
Stay ahead with the latest trends and market analysis.

The North America active pharmaceutical ingredients market was valued at USD 70.76 Billion in 2025, driven by the growing demand for pharmaceuticals and the rising advancements in API manufacturing processes in the region. The market is expected to grow at a CAGR of 3.60% during the forecast period of 2026-2035, with the values likely to reach USD 100.78 Billion by 2035.
Base Year
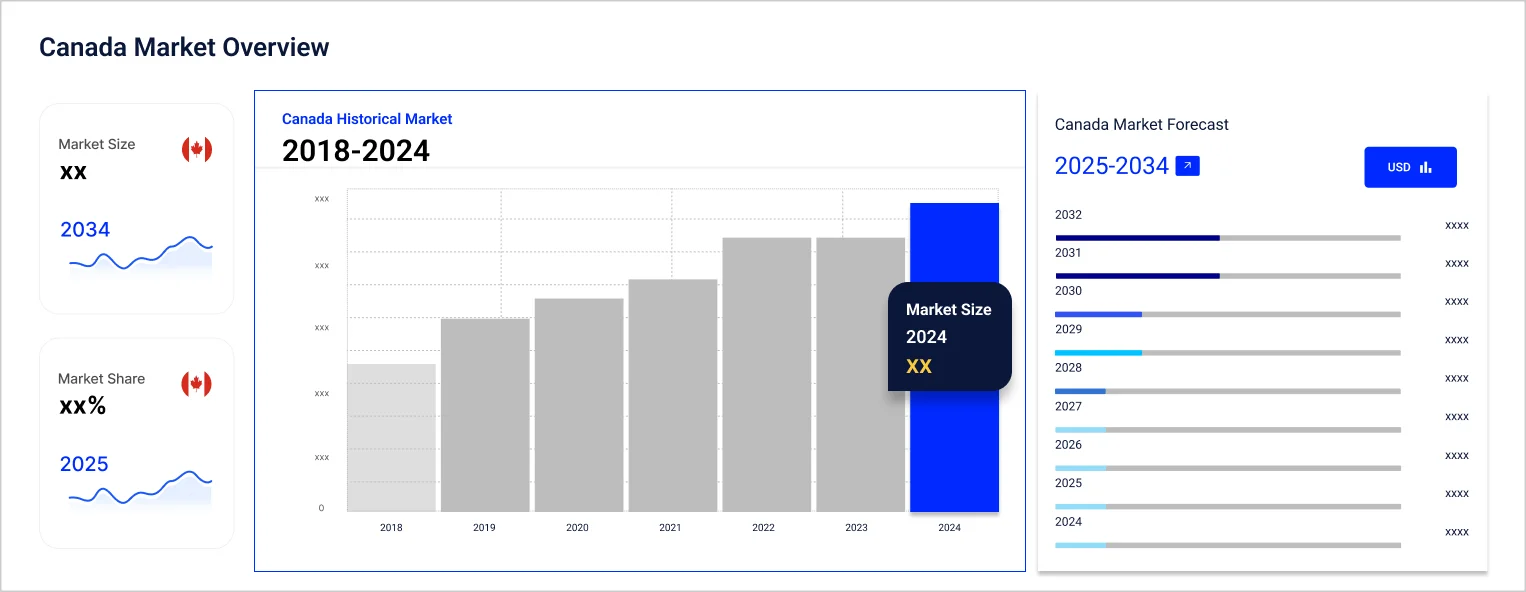
Historical Period
Forecast Period
The increase in generic drug production and the rising technological advancements in API manufacturing are some of the factors propelling the market demand.
The market value is influenced by the growing outsourcing trends, with many pharmaceutical companies seeking contract development and manufacturing organizations' services for API production.
The synthetic APIs segment represents a major market share owing to the cost-effectiveness of synthetic APIs compared to biotech APIs as well as their high scalability.
Compound Annual Growth Rate
3.6%
Value in USD Billion
2026-2035
*this image is indicative*
Active pharmaceutical ingredient (API) is defined as the biologically active constituent of a drug product that delivers the desired therapeutic effect. APIs can be produced synthetically through chemical processes or can be biologically derived via biotechnological methods. In North America, the rising burden of chronic diseases, the increasing advancements in API production, and the growth of the generic drug sector are significantly contributing to the expansion of the global active pharmaceutical ingredients (API) market. The outsourcing of API production is a major market trend that helps pharmaceutical companies reduce manufacturing costs and focus more on their core competencies. Additionally, factors such as the rise in strategic partnerships among pharma companies, increasing investment in research and development, and the presence of a positive regulatory environment are shaping the market landscape in North America.
Substantial Investment in API Production to Meet Rising Market Demand
In May 2024, pharmaceutical giant Eli Lilly and Company announced a USD 5.3 billion investment in its manufacturing site in Lebanon (Indiana, United States) to boost the production capacity of active pharmaceutical ingredients (APIs). The investment was intended particularly for its type 2 diabetes and obesity drugs, namely, Mounjaro® (tirzepatide) injection and Zepbound® (tirzepatide) injection. This major investment is reported as the largest manufacturing investment in the company’s history and the biggest synthetic medicine API manufacturing investment in the United States' history. Such significant financial commitments by the key market players to expand the API manufacturing capacity and capabilities are anticipated to propel the market growth in the forecast period.
The market is witnessing several trends and developments to improve the current scenario in North America. Some of the notable trends are as follows:
The EMR’s report titled “North America Active Pharmaceutical Ingredients Market Report and Forecast 2026-2035” offers a detailed analysis of the market based on the following segments:
Market Breakup by Drug Type
Market Breakup by Type of Manufacturer
Market Breakup by Type of Synthesis
Market Breakup by Application
Market Breakup by Country
Market Segmentation Based on Type of Synthesis is Anticipated to Witness Substantial Growth
Based on the type of synthesis, the market is segmented into synthetic active pharmaceutical ingredients and biotech active pharmaceutical ingredients. Synthetic APIs are chemically synthesized through various chemical processes whereas biotech APIs are derived from biological sources through certain biotechnological processes. The synthetic APIs segment covers a major market share owing to its cost-effectiveness compared to biotech APIs as well as high scalability which allows their mass production. The rising advancements in chemical synthesis technologies and their widespread use in various therapeutic areas also aid in the segment's growth.
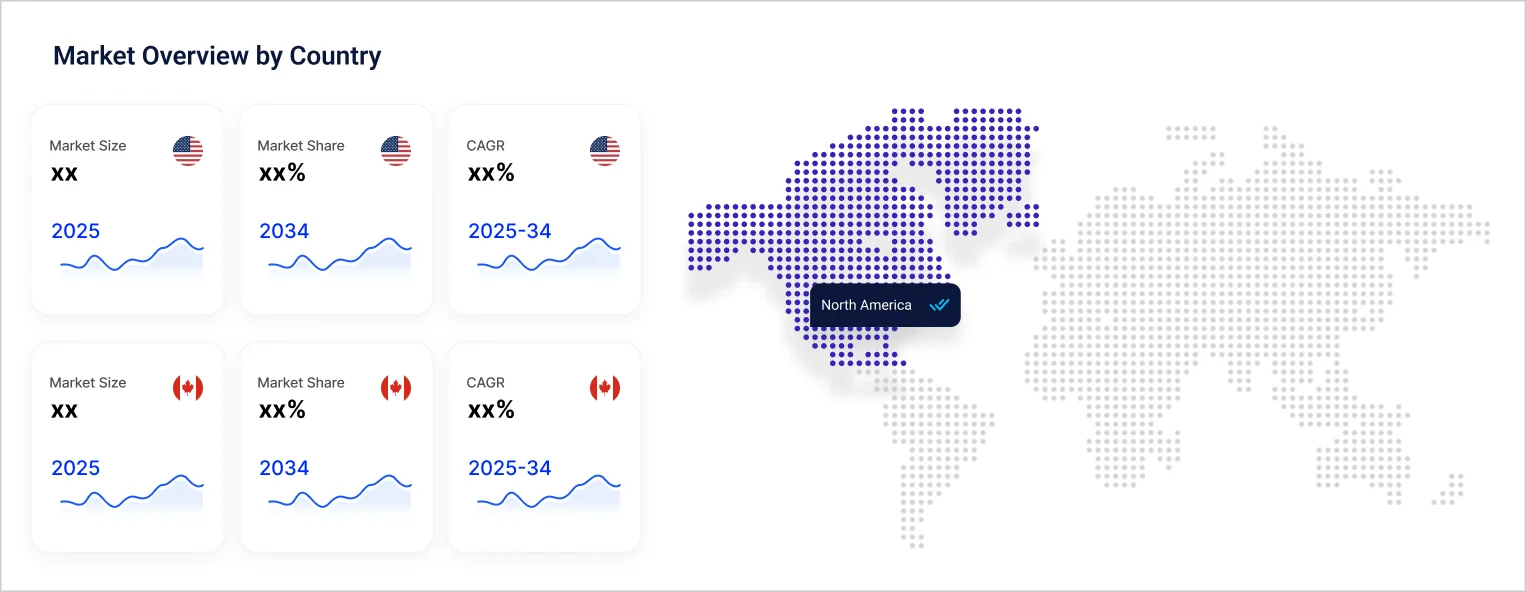
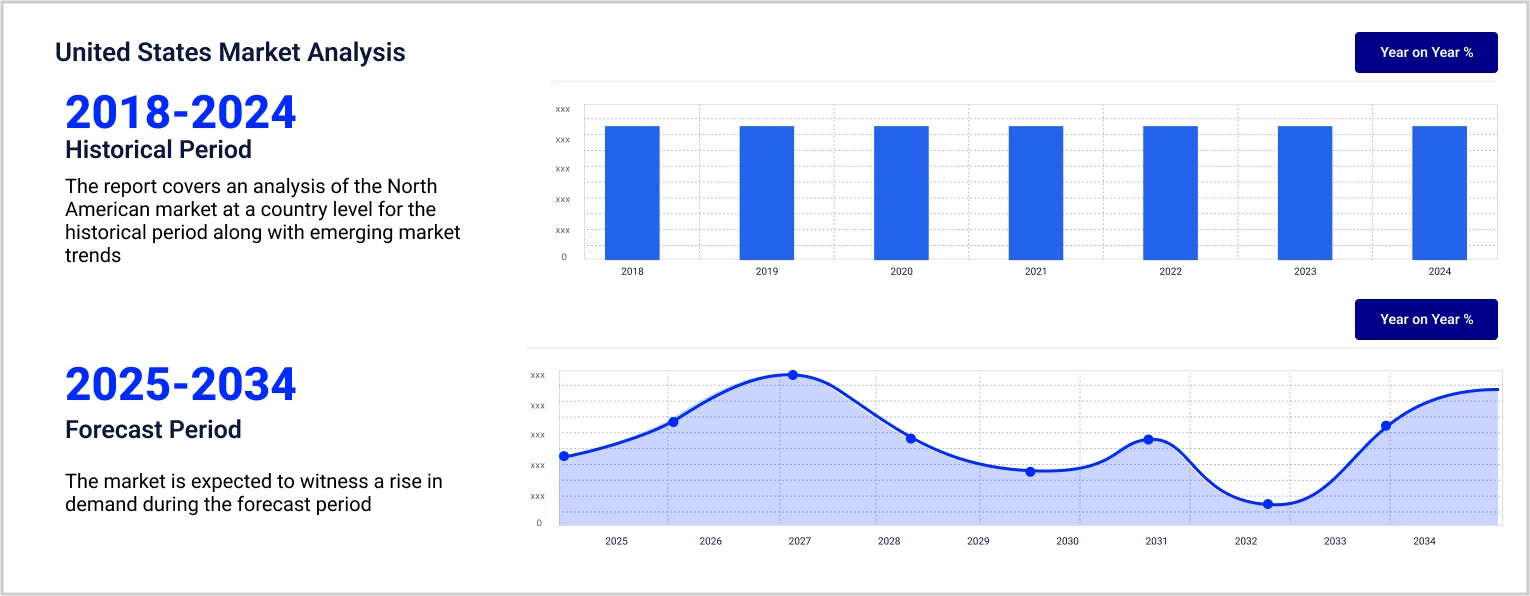
Based on the region, the United States covers the largest share of the active pharmaceutical ingredient market in North America. The market share can be attributed to its advanced pharmaceutical sector and a supportive regulatory framework. The presence of leading biotech companies and research institutions involved in the development of new therapies in the region further bolsters the market demand for high-quality APIs.
Canada also contributes significantly to the North America active pharmaceutical ingredients market growth. With the pharmaceutical infrastructure witnessing continuous expansion in the region, the demand for APIs is expected to surge in the coming years. Additionally, increased focus on domestic production of APIs is likely to influence market dynamics in the Canadian market.
The key features of the market report comprise the patent analysis, funding and investment analysis, and strategic initiatives by the leading key players. The major companies in the market are as follows:
Headquartered in North Chicago (Illinois), AbbVie Inc. is a global biopharmaceutical company that is known for its significant investment in R&D to enhance its active pharmaceutical ingredient offerings in the fields of oncology, immunology, and virology, among others.
Leading biopharmaceutical company Bristol-Myers Squibb leverages its advanced research facilities to develop high-quality active pharmaceutical ingredients (APIs) and is recognized for its pipeline of drugs in oncology, cardiovascular diseases, and immunology.
New Jersey-based Merck & Co., Inc. is a multinational pharmaceutical company that offers small molecule API process development and manufacturing services. It provides APIs across various therapeutic areas including vaccines and infectious diseases.
American pharmaceutical firm Eli Lilly and Company has a robust presence in the market and is actively engaged in efforts to enhance its API development and production capabilities. The company has made substantial investments in synthetic medicine active pharmaceutical ingredient (API) manufacturing to boost its production capacity.
*Please note that this is only a partial list; the complete list of key players is available in the full report. Additionally, the list of key players can be customized to better suit your needs.*


Upto 15% Off
USD
$2699 $2429
$4299 $3869
$5799 $4949
$6999 $5949


*While we strive to always give you current and accurate information, the numbers depicted on the website are indicative and may differ from the actual numbers in the main report. At Expert Market Research, we aim to bring you the latest insights and trends in the market. Using our analyses and forecasts, stakeholders can understand the market dynamics, navigate challenges, and capitalize on opportunities to make data-driven strategic decisions.*
Get in touch with us for a customized solution tailored to your unique requirements and save upto 35%!
Explore our key highlights of the report and gain a concise overview of key findings, trends, and actionable insights that will empower your strategic decisions.
| REPORT FEATURES | DETAILS |
| Base Year | 2025 |
| Historical Period | 2019-2025 |
| Forecast Period | 2026-2035 |
| Scope of the Report |
Historical and Forecast Trends, Industry Drivers and Constraints, Historical and Forecast Market Analysis by Segment:
|
| Breakup by Drug Type |
|
| Breakup by Type of Manufacturer |
|
| Breakup by Type of Synthesis |
|
| Breakup by Application |
|
| Breakup by Region |
|
| Market Dynamics |
|
| Supplier Landscape |
|
| Companies Covered |
|
Datasheet
One User
USD 2,699
USD 2,429
tax inclusive*
Single User License
One User
USD 4,299
USD 3,869
tax inclusive*
Five User License
Five User
USD 5,799
USD 4,949
tax inclusive*
Corporate License
Unlimited Users
USD 6,999
USD 5,949
tax inclusive*
*Please note that the prices mentioned below are starting prices for each bundle type. Kindly contact our team for further details.*
Flash Bundle
Small Business Bundle
Growth Bundle
Enterprise Bundle
*Please note that the prices mentioned below are starting prices for each bundle type. Kindly contact our team for further details.*
Flash Bundle
Number of Reports: 3
20%
tax inclusive*
Small Business Bundle
Number of Reports: 5
25%
tax inclusive*
Growth Bundle
Number of Reports: 8
30%
tax inclusive*
Enterprise Bundle
Number of Reports: 10
35%
tax inclusive*
How To Order

Select License Type
Choose the right license for your needs and access rights.

Click on ‘Buy Now’
Add the report to your cart with one click and proceed to register.

Select Mode of Payment
Choose a payment option for a secure checkout. You will be redirected accordingly.
Gain insights to stay ahead and seize opportunities.

Get insights & trends for a competitive edge.

Track prices with detailed trend reports.

Analyse trade data for supply chain insights.

Leverage cost reports for smart savings

Enhance supply chain with partnerships.

Connect For More Information
Our expert team of analysts will offer full support and resolve any queries regarding the report, before and after the purchase.
Our expert team of analysts will offer full support and resolve any queries regarding the report, before and after the purchase.
We employ meticulous research methods, blending advanced analytics and expert insights to deliver accurate, actionable industry intelligence, staying ahead of competitors.
Our skilled analysts offer unparalleled competitive advantage with detailed insights on current and emerging markets, ensuring your strategic edge.
We offer an in-depth yet simplified presentation of industry insights and analysis to meet your specific requirements effectively.


Share