

Consumer Insights
Uncover trends and behaviors shaping consumer choices today
Procurement Insights
Optimize your sourcing strategy with key market data
Industry Stats
Stay ahead with the latest trends and market analysis.

The global non-GMO food market size reached around USD 2.05 Billion in 2025. The market is projected to grow at a CAGR of 16.70% between 2026 and 2035 to reach nearly USD 9.60 Billion by 2035.
Base Year
Historical Period
Forecast Period
Since 2008, the Non-GMO Project has verified over 60,000 products from more than 3,000 brands, and 47% of Non-GMO Project Verified products are certified by the USDA.
As per the European Non-GMO Industry Association, sales of "Ohne Gentechnik" ("Without genetic engineering”) products in Germany surged by 21%, reaching EUR 16 billion and comprising over 15,000 products.
In 2019, the member companies of the German Association Verband Lebensmittel ohne Gentechnik (VLOG; Association Food without Genetic Engineering) generated sales of EUR 8.8 billion.
Compound Annual Growth Rate
16.7%
Value in USD Billion
2026-2035
*this image is indicative*
Read more about this report - REQUEST FREE SAMPLE COPY IN PDF
The growing food demand and the rising focus on boosting the sustainability of the food value chain are propelling the non-GMO food industry revenue. By 2050, around 10 billion individuals will live on the planet and greenhouse gas emissions are estimated to reach 15 gigatons (Gt) of carbon dioxide equivalent (CO2-e). According to a survey conducted by PwC in 2024, 60% of customers in India are actively choosing sustainable products and are willing to pay 13.1% more for such products (compared to the global average of 9.7%). Hence, the growing awareness of sustainability is prompting farmers to adopt non-GMO practices to promote diversity and regenerative agricultural techniques. Besides, the increasing launches of healthy and non-GMO snacks by key players are surging the non-GMO food market value. In December 2023, CauliPuffs debuted its non-GMO, gluten-free, and soy-free wholesome puffed snack line, made from a blend of rice, cauliflower, and corn.
Increasing Health Consciousness
The increasing health consciousness, especially after the COVID-19 pandemic, is shaping the non-GMO food market trends and dynamics. In 2022, a survey commissioned by Nutrisystem and conducted by OnePoll stated that 2 in 3 Americans have become more health-conscious post the COVID-19 pandemic, with weight loss and healthy lifestyle being the leading concerns. Similarly, a survey by the UK government in 2021 found that 8 in 10 adults over 18 years of age aim to modify their lifestyle and 40% of 6 million adults aged between 40 and 60 years plan to eat healthier foods. In 2023, it was reported that 73% of Chinese customers were willing to pay for healthier food. Non-GMO crops are associated with organic farming methods, emphasising biodiversity and optimal soil health while resulting in higher-quality produce. Non-GMO food products are less processed and contain fewer preservatives and artificial ingredients. Various studies have also demonstrated the effectiveness of non-GMO foods in reducing allergies and sensitives, which further boost their appeal among the health-conscious population.
Growing Sustainability Concerns
The introduction of government initiatives aimed at enhancing the sustainability of the agricultural sector and reducing fertiliser and pesticide usage is aiding the non-GMO food market expansion. For instance, under the Green Deal’s Farm to Fork strategy, the European Commission aims to increase organic farming to cover at least 25% of the EU’s arable land by 2030. The cultivation of non-GMO crops reduces soil erosion, helps keep the soil fertile, encourages sustainable and diverse farming practices like organic farming and crop rotation, requires fewer resources and energy, and supports environmental well-being and long-term food security. Non-GMO crops are grown using organic farming methods that eliminate the use of synthetic chemicals, lowering chemical runoff into water and soil sources. Such crops also support sustainable livestock feed, leading to better animal health and welfare. Besides, non-GMO crops are typically more resilient to evolving climatic conditions, minimising the risk of crop failure and enhancing food security. Moreover, the growing health consciousness is significantly surging the non-GMO food industry revenue. A 2022 survey revealed that two-thirds of Americans have become more health-focused post-COVID-19 pandemic, prioritising weight loss and healthier lifestyles. Non-GMO foods are free from artificial ingredients and are less processed than their GMO counterparts, making them appealing to health-conscious customers.
February 2024
Organic Valley launched Flavor Favorites, its new line of delicious and real organic cheese that can enhance snacking and mealtime by incorporating new flavour experiences. The new cheese is USDA organic certified, non-GMO, and produced with antibiotics, toxic pesticides, and synthetic hormones.
July 2021
The Hain Celestial Group, Inc. announced various innovations across its multile product lines, including Celestial Seasonings, Sensible Portions, and JĀSÖN amid the growing health consciousness. Sensible Portions introduced Garden Veggie Puffs in three flavours- Sour Cream & Onion, White Cheddar, and Screamin’ Hot, made with non-GMO ingredients and contains no preservatives or artificial flavours.
The rising health consciousness, coupled with the growing inclination of consumers towards a vegetarian and vegan lifestyle, is driving the growth of the global non-GMO food market. Surveys indicate that two-thirds of Americans prioritise healthier lifestyles, with many willing to pay more for non-GMO options. The surging expenditure by the major players in the R&D sector to procure non-GMO crops and ingredients like grains, seeds, and fruits, is also supporting the market expansion. Non-GMO foods are linked to organic farming, promoting biodiversity and soil health, while also being less processed and free from artificial ingredients. Government initiatives, like the EU's Farm to Fork strategy, support sustainable agriculture, reducing pesticide use and enhancing food security. Further, the growing expansion of production facilities to fulfil the growing demand for non-GMO food products is expected to aid the market over the forecast period.
There is a limited understanding regarding the benefits of non-GMO foods among customers. High prices of non-GMO foods as compared to their GMO counterparts can limit their accessibility among price-sensitive customers. Such foods are also not readily available in major distribution channels, especially in remote and rural areas, which can hinder the non-GMO food market development. Furthermore, obtaining a non-GMO certification for companies can be time-consuming and expensive, limiting the foray of small businesses and farms.
Read more about this report - REQUEST FREE SAMPLE COPY IN PDF
The EMR’s report titled “Non-GMO Food Market Report and Forecast 2026-2035” offers a detailed analysis of the market based on the following segments:
Market Breakup by Product
Market Breakup by Distribution Channel
Market Breakup by Region
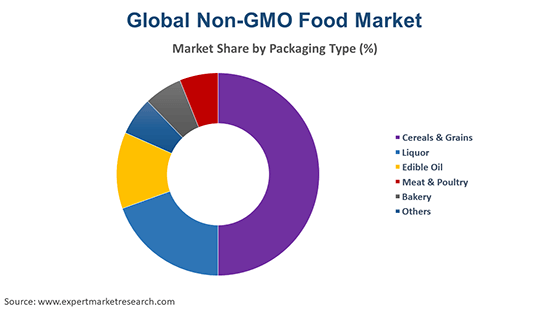
By Product Insights
Non-GMO cereals and grains are typically derived from barley, oats, corn, rice, and wheat, and are typically rich in minerals, fibres, and vitamins. They are primarily used in foods such as pasta, bread, and breakfast cereals, among others, to improve their nutritional profile and safety.
The increasing launches of food products containing non-GMO cereals and grains are aiding the non-GMO food market development. In August 2022, Purely Elizabeth, a brand specialising in naturally nutritious and gluten-free breakfast, launched Superfood Cereal with Vitamin D in two delicious flavours, Honey Peanut Butter and Vanilla Blueberry Almond. The cereal is certified non-GMO project verified and gluten-free and is an excellent source of Vitamin D and fibre.
Meanwhile, non-GMO liquors are gaining popularity amid rising health concerns regarding the impact of GMOs. Manufactured from traditional ingredients that are not genetically altered, non-GMO liquors boast more authentic flavour profiles and higher quality than their traditional counterparts. To capitalise on the rising demand for alcohol with enhanced flavour profiles, key players are incorporating non-GMO ingredients in liquors. For instance, in April 2024, Aplós launched Aplós Cocktails, its line of ready-to-drink canned cocktails that are non-GMO and gluten-free and contain no added sugar.
By Distribution Channel Insights
Supermarkets and hypermarkets represent a major share of the market as they provide a range of products in a single location, offer a diverse range of non-GMO foods, and run attractive promotions and discounts. Renowned supermarkets and hypermarkets with stringent quality control measures stock high-quality non-GMO products, which further bolsters their appeal. Such stores also frequently stock products sourced from local non-GMO farms, appealing to customers supporting local and community agriculture. In April 2021, the Kingfish Company announced that its non-GMO, sustainable, and antibiotic-free ready-to-eat raw seafood product was launched in Whole Foods Market stores across the US.
Meanwhile, customers seeking tailored shopping experiences prefer speciality stores for purchasing non-GMO foods. Such stores typically boast knowledgeable employees who can provide recommendations and insights regarding non-GMO foods. In addition, speciality stores stock high-quality and organic non-GMO options and support small businesses that provide unique non-GMO food options.


North America Non-GMO Food Market Drivers
The Non-GMO Project’s butterfly in the United States is a certification that is granted to products that meet stringent regulations to ensure that bioengineered or genetically modified ingredients are not included. In 2022, frozen and refrigerated poultry, meat, and seafood products with the butterfly labelling witnessed a growth of 52.5% whereas products that simply claimed themselves non-GMO saw 40.5% growth. The expanding manufacturing activities of non-GMO food products in the region are boosting the non-GMO food market revenue. In August 2024, Grainwell Puffed Grains announced that it began the production of its clean-labelled, non-GMO, and single-ingredient puffed grain production at its facility in Dyersville, Iowa.
Europe Non-GMO Food Market Growth
In the European Union, GMOs are banned in the organic sector, which reached EUR 54.68 billion in 2021, as per the USDA’s Foreign Agricultural Service. Hence, the increasing demand for organic food in the region favours the non-GMO food market expansion. As per the European Non-GMO Industry Association, the conventional non-GMO market recorded sales of EUR 16 billion in Germany and EUR 2.5 billion in Austria in 2022. In April 2024, the European Union announced EUR 11 million in funding for two projects, DARWIN and DETECTIVE, to develop innovative and new detection methods for new GMOs, which are indistinguishable from conventional plants.
A survey by Food Standards Scotland in 2020 found that genetically engineered foods are a top concern for 57% of consumers, next only to chlorinated chicken. Similarly, another study conducted by the National Centre for Social Research in the same year found that 59% of the UK population aims to maintain a ban on GM crops. Moreover, a survey by the UK’s Economic and Social Research Council in 2021 showed that 64% of individuals were opposed to the cultivation of genetically engineered foods.
Asia Pacific Non-GMO Food Market Trends
The non-GMO food demand growth in the Asia Pacific is being driven by the growing consumer demand for transparent, clean-labelled, healthy, and sustainable food options. The increasing middle-class population and rapid urbanisation in emerging economies such as India, China, Vietnam, and Indonesia, among others, are also providing lucrative non-GMO food market opportunities. In May 2024, the Indian Agricultural Research Institute launched non-GM herbicide tolerant Basmati rice varieties, RobiNOweed, in two varieties- Pusa Basmati 1979 and Pusa Basmati 1985, addressing sustainability concerns and labour issues.
Key non-GMO food market players are investing in research activities to develop non-GMO alternatives to popular food products such as meat-based dishes and desserts. With the growing trend of sustainability, they are also adopting eco-friendly packaging solutions and sourcing non-GMO ingredients from organic farms.
The Hain Celestial Group, Inc., founded in 1993 and headquartered in New York, United States, is a prominent food and beverage and personal care company. The company is known for its commitment to offering healthy food options to its customers. Some of its popular non-GMO brands include Blue Diamond Almonds, Earth's Best, Alfie’s, and Garden of Eatin’, among others.
Amy's Kitchen, Inc., established in 1987, is a leading organic and vegetarian food company, headquartered in California, United States. Some of its popular products include organic soups, non-GMO snacks, gluten-free frozen pizza, and frozen entrees. The company is committed to sustainable practices, such as minimising its carbon footprints, reducing waste, and supporting organic agriculture.
Organic Valley, established in 1988, is one of the largest organic farming companies in the United States. Headquartered in Wisconsin, the company aims to provide high-quality organic meat and dairy products. Some of its key offerings are plant-based non-dairy products, grass-fed organic poultry and beef, and pasture-raised eggs, among others.
*Please note that this is only a partial list; the complete list of key players is available in the full report. Additionally, the list of key players can be customized to better suit your needs.*
Other key players in the market include Nature's Path Foods and United Natural Foods, Inc., among others.
September 2024
Amy's Kitchen forayed into the frozen breakfast category with the launch of delicious and convenient wraps, burritos, and entrees. The products are made using non-GMO and organic ingredients and are free from peanuts, eggs, seafood, and meat.
May 2024
S&W Seed Company announced the commercial launch of the Double Team Forage Sorghum, providing forage sorghum growers with an over-the-top, grassy, and non-GMO weed control option.


Upto 15% Off
USD
$2499 $2249
$3999 $3599
$4999 $4249
$5999 $5099


*While we strive to always give you current and accurate information, the numbers depicted on the website are indicative and may differ from the actual numbers in the main report. At Expert Market Research, we aim to bring you the latest insights and trends in the market. Using our analyses and forecasts, stakeholders can understand the market dynamics, navigate challenges, and capitalize on opportunities to make data-driven strategic decisions.*
Get in touch with us for a customized solution tailored to your unique requirements and save upto 35%!
In 2025, the market attained a value of nearly USD 2.05 Billion.
The market is assessed to grow at a CAGR of 16.70% between 2026 and 2035.
The market is estimated to witness a healthy growth in the forecast period of 2026-2035 to reach about USD 9.60 Billion by 2035.
The major drivers of the market include the rising expenditure by the major players in the R&D sector, growing expansion of production facilities, growing population, enhanced accessibility to raw materials, and reduced labour cost.
The rising health consciousness and the growing inclination of consumers towards vegetarian and vegan lifestyles are the key trends guiding the market.
The major regions in the market are North America, Latin America, the Middle East and Africa, Europe, and the Asia Pacific.
The major products considered in the market report include cereals and grains, liquor, edible oil, meat and poultry, and bakery, among others.
The several distribution channels of non-GMO food in the market are hypermarkets and supermarkets, food speciality stores, and convenience stores, among others.
The major players in the market are The Hain Celestial Group, Inc., Amy's Kitchen, Inc., Organic Valley, Nature's Path Foods, and United Natural Foods, Inc., among others.
Explore our key highlights of the report and gain a concise overview of key findings, trends, and actionable insights that will empower your strategic decisions.
| REPORT FEATURES | DETAILS |
| Base Year | 2025 |
| Historical Period | 2019-2025 |
| Forecast Period | 2026-2035 |
| Scope of the Report |
Historical and Forecast Trends, Industry Drivers and Constraints, Historical and Forecast Market Analysis by Segment:
|
| Breakup by Product |
|
| Breakup by Distribution Channel |
|
| Breakup by Region |
|
| Market Dynamics |
|
| Competitive Landscape |
|
| Companies Covered |
|
| Report Price and Purchase Option | Explore our purchase options that are best suited to your resources and industry needs. |
| Delivery Format | Delivered as an attached PDF and Excel through email, with an option of receiving an editable PPT, according to the purchase option. |
Datasheet
One User
USD 2,499
USD 2,249
tax inclusive*
Single User License
One User
USD 3,999
USD 3,599
tax inclusive*
Five User License
Five User
USD 4,999
USD 4,249
tax inclusive*
Corporate License
Unlimited Users
USD 5,999
USD 5,099
tax inclusive*
*Please note that the prices mentioned below are starting prices for each bundle type. Kindly contact our team for further details.*
Flash Bundle
Small Business Bundle
Growth Bundle
Enterprise Bundle
*Please note that the prices mentioned below are starting prices for each bundle type. Kindly contact our team for further details.*
Flash Bundle
Number of Reports: 3
20%
tax inclusive*
Small Business Bundle
Number of Reports: 5
25%
tax inclusive*
Growth Bundle
Number of Reports: 8
30%
tax inclusive*
Enterprise Bundle
Number of Reports: 10
35%
tax inclusive*
How To Order

Select License Type
Choose the right license for your needs and access rights.

Click on ‘Buy Now’
Add the report to your cart with one click and proceed to register.

Select Mode of Payment
Choose a payment option for a secure checkout. You will be redirected accordingly.
Gain insights to stay ahead and seize opportunities.

Get insights & trends for a competitive edge.

Track prices with detailed trend reports.

Analyse trade data for supply chain insights.

Leverage cost reports for smart savings

Enhance supply chain with partnerships.

Connect For More Information
Our expert team of analysts will offer full support and resolve any queries regarding the report, before and after the purchase.
Our expert team of analysts will offer full support and resolve any queries regarding the report, before and after the purchase.
We employ meticulous research methods, blending advanced analytics and expert insights to deliver accurate, actionable industry intelligence, staying ahead of competitors.
Our skilled analysts offer unparalleled competitive advantage with detailed insights on current and emerging markets, ensuring your strategic edge.
We offer an in-depth yet simplified presentation of industry insights and analysis to meet your specific requirements effectively.


Share