

Consumer Insights
Uncover trends and behaviors shaping consumer choices today
Procurement Insights
Optimize your sourcing strategy with key market data
Industry Stats
Stay ahead with the latest trends and market analysis.

The non-alcoholic beverages market is expected to grow at a CAGR of 5.30% during the period 2026-2035. North America, Europe and Asia are likely to be key markets.
Base Year
Historical Period
Forecast Period
Total dollar sales of non-alcoholic drinks in the US grew by 20.6% between August 2021 and August 2022, showcasing market’s potential for growth.
Over USD 1.8 billion was spent on advertising for non-alcoholic beverages in the United States from January to November 2023. This raised awareness for the benefits of such drinks.
31% of New Zealanders have decreased their alcohol consumption over the last five years, which has positively impacted the demand for non-alcoholic drinks.
Compound Annual Growth Rate
5.3%
2026-2035
*this image is indicative*
| Global Non-Alcoholic Beverages Market Report Summary | Description | Value |
| Base Year | USD Million | 2025 |
| Historical Period | USD Million | 2019-2025 |
| Forecast Period | USD Million | 2026-2035 |
| Market Size 2025 | USD Million | XX |
| Market Size 2035 | USD Million | XX |
| CAGR 2019-2025 | Percentage | XX% |
| CAGR 2026-2035 | Percentage | 5.30% |
| CAGR 2026-2035 - Market by Region | Asia Pacific | 6.1% |
| CAGR 2026-2035 - Market by Country | India | 7.0% |
| CAGR 2026-2035 - Market by Country | China | 5.9% |
| CAGR 2026-2035 - Market by Type | Non-Carbonated | 5.8% |
| CAGR 2026-2035 - Market by Distribution Channels | Online | 9.0% |
| Market Share by Country 2025 | Germany | 4.5% |
Non-alcoholic beverages refer to drinks that either have no alcohol or below 0.5 percent alcohol by volume (abv). Such beverages may include a range of hot and cold simple and exotic drinks. Almost every sector of the food service industry offers one or several types of non-alcoholic drinks.
Categories of non-alcoholic beverages include tea, coffee, milk-based drinks, chocolate, mocktails, milkshakes, aerated drinks, non-alcoholic beers like root beer, squashes, juices, etc. While several of these beverage’s hydrate, some may offer important nutrients and vitamins to the body. Other beverages energize, offer needed sugar and calories.
Changing consumer preferences towards healthier lifestyles, increasing urbanisation, and rising disposable incomes are significant drivers influencing non-alcoholic beverages market development. Additionally, the expansion of retail channels and the growing demand for functional beverages, natural juices, and herbal teas are contributing to the market growth. Furthermore, the increasing consumption of refreshment drinks in social occasions is also influencing the market.
Read more about this report - REQUEST FREE SAMPLE COPY IN PDF
Changing consumer preferences, innovations in flavour and packaging, and development of functional drinks are factors boosting the non-alcoholic beverages market expansion
One of the key trends driving the non-alcoholic beverages market growth is the rising demand for beverages with functional benefits, such as antioxidants, vitamins, and minerals. Examples of functional drinks include sports drink, probiotic kombucha, or tea-infused carbonated drinks.
The shift towards healthier lifestyle choices and the growing awareness of the adverse health effects associated with high sugar and calorie intake are driving the demand for low-calorie and naturally flavoured carbonated beverages.
Another key trend providing a favourable non-alcoholic beverages market outlook is the shift towards sustainable and innovative packaging, such as eco-friendly bottles and cans, to appeal to environmentally conscious consumers.
The high sugar content in many beverages is a major concern for health-conscious consumers. This is driving the demand for sugar-free non-alcoholic beverages, where either no sugar or artificial sweeteners, such as stevia, xanthan gum, and aspartame are used.
The increased availability of non-alcoholic drinks is likely to lead to higher consumption rates, as consumers tend to opt for non-alcoholic beverages when they are more readily available than their alcoholic counterparts. Moreover, excessive alcohol consumption is a significant global health risk, resulting in over 95,000 deaths annually, or approximately 261 deaths per day. Similarly, 9 million men and 5.5 million women had an alcohol use disorder (AUD) in the past year, highlighting the importance of quitting alcohol. These statistics demonstrates the need for healthier beverages and hence, can drive non-alcoholic beverages market growth in the forecast period.
Another trend in the market is rising demand for non-carbonated beverages as younger consumers are looking for alternatives to carbonated drinks offered by companies, such as Coca Cola and Pepsi Co. Manufacturers, in turn, are looking to offer products that appeal to such consumers. Companies like Naturedge Beverages Pvt. Ltd. have taken drinks to the next level by adding antioxidants and vitamins to them. Such developments are expected to drive the market’s expansion even further.
Read more about this report - REQUEST FREE SAMPLE COPY IN PDF
The EMR’s report titled “Non-alcoholic Beverages Market Report and Forecast 2026-2035” offers a detailed analysis of the market based on the following segments:
Market Breakup by Type
Market Breakup by Distribution Channels
Market Breakup by Region
Non-carbonated beverage segment is driven by the growing demand for healthy and natural beverages
The carbonated beverage segment includes a wide range of products such as cola, lemon-lime soda, and ginger ale, which are often sweetened and flavoured to provide a refreshing and effervescent experience. These beverages are commonly consumed on their own or used as mixers in cocktails, offering versatility in both casual and social settings.
On the other hand, in non-carbonated beverage segment, the fruit and vegetable category is particularly significant, driven by consumers' increasing demand for healthy and natural beverages. The functional drinks segment is also growing rapidly, as consumers seek beverages that offer additional health benefits beyond hydration, such as immune support, energy boosting, and weight management.
As per non-alcoholic beverages market analysis, ready-to-drink tea and coffee segments are also gaining traction as it provides a convenient and portable option for consumers on-the-go. Bottled water is another significant segment, driven by growing concerns about hydration and the convenience of bottled water.
Based on distribution channels, supermarkets and hypermarkets dominate the market share
Supermarkets and hypermarkets dominate the distribution landscape as these large-format retail outlets offer consumers a one-stop-shop experience, providing a wide selection of non-alcoholic beverages ranging from carbonated sodas and fruit juices to functional drinks and bottled water. For instance, Walmart, a leading retailer, offers a vast array of non-alcoholic beverages under its Great Value and Sam's Choice brands. The convenience of bulk purchasing, competitive pricing, and promotional offers have made supermarkets and hypermarkets the preferred destination for many consumers when it comes to stocking up on non-alcoholic beverages.
Convenience stores represent another significant distribution channel, catering to the demand for quick and accessible beverage options. These small-format stores, known for their extended operating hours and strategic locations, have carved out a considerable non-alcoholic beverages market share. Convenience stores excel in providing on-the-go solutions, particularly for impulse purchases and immediate consumption. For example, 7-Eleven, a global convenience store chain, offers a wide range of non-alcoholic beverages, including popular brands like Coca-Cola and Pepsi, as well as its own private-label products.
Market players are focused on development of functional beverages, low-sugar drinks, and eco-friendly packaging to cater to changing consumer preferences
PepsiCo, Inc. is a multinational food and beverage corporation that offers soft drinks, juices, and snacks. Headquartered in New York, United States, PepsiCo was founded in 1965 through the merger of Pepsi-Cola and Frito-Lay. The company's portfolio includes popular brands such as Pepsi, Gatorade, Tropicana, and Lay's potato chips.
The Coca-Cola Company is a multinational beverage corporation that is best known for its flagship product, Coca-Cola, a carbonated soft drink. It also produces other beverages, such as Fanta, Sprite, and Minute Maid. With its headquarters in Georgia, United States, the company was founded in 1886. The company has expanded its portfolio by launching Diet Coke, Coke Zero, and Vitamin water.
Nestle S.A. is a Swiss multinational food and beverage company that produces a diverse range of products, including coffee, chocolate, and infant nutrition. It also has a significant presence in the beverage market. Headquartered in Vevey, Switzerland, it was founded in 1866. The company's beverage portfolio includes brands such as Nescafe, Gerber, and PowerBar.
Monster Energy Company is a leading energy drink brand that is known for its high-caffeine content and association with extreme sports. It is partially owned by The Coca-Cola Company. Headquartered in California, United States, it was founded in 2002. It has expanded its product line by launching beverages like Monster Java and Muscle Monster.
*Please note that this is only a partial list; the complete list of key players is available in the full report. Additionally, the list of key players can be customized to better suit your needs.*
Other key players in the global non-alcoholic beverages market include H.J. Heinz Company Brands LLC and Reed’s, Inc., among others.


North America leads the market due to the rising cases of AUD and increasing demand for healthier drinks
North American market is growing due to an increasing demand for functional beverages with health benefits and the rising popularity of plant-based beverages. Moreover, the region's strong presence of established brands and widespread distribution networks contribute to its market leadership. Coca-Cola has launched a new line of functional beverages, including a line of energy drinks and a line of beverages with plant-based ingredients, to cater to the growing demand for health-conscious beverages. Additionally, PepsiCo has acquired Keurig Dr Pepper, a leading manufacturer of coffee and tea beverages, to expand its presence in the non-alcoholic beverages market.
| CAGR 2026-2035 - Market by | Country |
| India | 7.0% |
| China | 5.9% |
| Canada | 5.0% |
| Germany | 4.4% |
| Italy | 3.7% |
| USA | XX% |
| UK | XX% |
| France | XX% |
| Japan | 3.7% |
| Australia | XX% |
| Saudi Arabia | XX% |
| Brazil | XX% |
| Mexico | XX% |
The Asia-Pacific non-alcoholic beverages market, on the other hand, is growing due to changing consumer preferences towards healthier drink options and innovative product offerings by manufacturers. Additionally, the growing disposable incomes in the region are leading to increased spending on non-alcoholic beverages, particularly in countries like China and India. Moreover, leading beverage companies in APAC are constantly developing innovative health drinks to meet the demand for healthier options. For instance, the Coca-Cola Company launched ethnic energy drink Jaljeera in India to cater to the demand for energy drinks in the country.
Global Alcoholic Beverages Market
Latin America Non-alcoholic Beverages Market
Colombia Non-Alcoholic Beverages Market
West Africa Alcoholic Beverages Market
South Korea Alcoholic Beverages Market
Mexico Alcoholic Beverages Market
Australia Alcoholic Beverages Market
United States Flavoured Alcoholic Beverages Market


Upto 15% Off
USD
$2499 $2249
$3999 $3599
$4999 $4249
$5999 $5099


*While we strive to always give you current and accurate information, the numbers depicted on the website are indicative and may differ from the actual numbers in the main report. At Expert Market Research, we aim to bring you the latest insights and trends in the market. Using our analyses and forecasts, stakeholders can understand the market dynamics, navigate challenges, and capitalize on opportunities to make data-driven strategic decisions.*
Get in touch with us for a customized solution tailored to your unique requirements and save upto 35%!
The non-alcoholic beverages market value is expected to grow at a CAGR of 5.30% between 2026 and 2035.
The major drivers of the market include the increasing footfall in bars and pubs, increasing number of alcohol quitters, and increasing popularity of non-alcoholic beers.
Non-alcoholic beer is gaining traction due to several health reasons. Alcoholic beer consumed in high amounts can cause blackouts and reduce the blood sugar levels in the body. Religious reasons can also be one of the factors for the growing consumption of non-alcoholic beer.
Some of the popular choices of non-alcoholic beverages include fruits juices, smoothies, milk shakes, and non-alcoholic cocktails, among others.
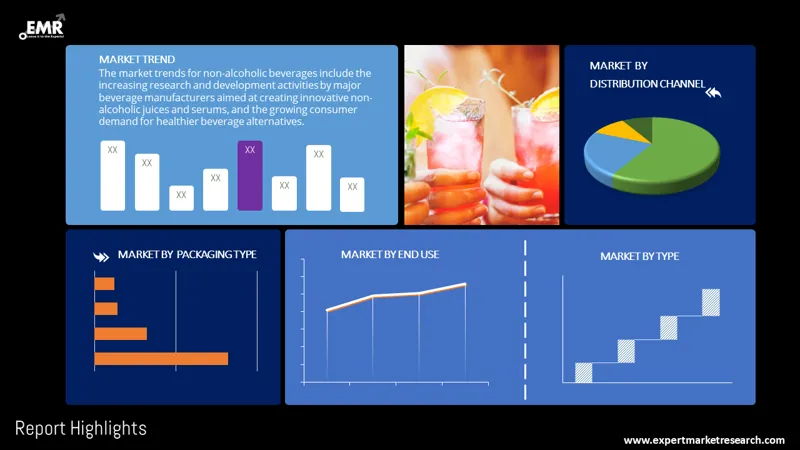
Key trends aiding market expansion include the growing research and development activities by the major beverage manufacturers aimed towards innovative non-alcoholic juices, demand for sugar-free drinks, and growing consumers’ desire for healthier alternatives are the key trends in the market.
Based on type, the market segmentations include carbonated soft drinks (CSD) and non-carbonated beverages.
Supermarkets/hypermarkets, convenience stores, speciality stores, and online, among others are the significant distribution channels in the market.
Regions considered in the market are North America, Europe, the Asia Pacific, Latin America, and the Middle East and Africa.
Explore our key highlights of the report and gain a concise overview of key findings, trends, and actionable insights that will empower your strategic decisions.
| REPORT FEATURES | DETAILS |
| Base Year | 2025 |
| Historical Period | 2019-2025 |
| Forecast Period | 2026-2035 |
| Scope of the Report |
Historical and Forecast Trends, Industry Drivers and Constraints, Historical and Forecast Market Analysis by Segment:
|
| Breakup by Type |
|
| Breakup by Distribution Channels |
|
| Breakup by Region |
|
| Market Dynamics |
|
| Trade Data Analysis |
|
| Competitive Landscape |
|
| Companies Covered |
|
Datasheet
One User
USD 2,499
USD 2,249
tax inclusive*
Single User License
One User
USD 3,999
USD 3,599
tax inclusive*
Five User License
Five User
USD 4,999
USD 4,249
tax inclusive*
Corporate License
Unlimited Users
USD 5,999
USD 5,099
tax inclusive*
*Please note that the prices mentioned below are starting prices for each bundle type. Kindly contact our team for further details.*
Flash Bundle
Small Business Bundle
Growth Bundle
Enterprise Bundle
*Please note that the prices mentioned below are starting prices for each bundle type. Kindly contact our team for further details.*
Flash Bundle
Number of Reports: 3
20%
tax inclusive*
Small Business Bundle
Number of Reports: 5
25%
tax inclusive*
Growth Bundle
Number of Reports: 8
30%
tax inclusive*
Enterprise Bundle
Number of Reports: 10
35%
tax inclusive*
How To Order

Select License Type
Choose the right license for your needs and access rights.

Click on ‘Buy Now’
Add the report to your cart with one click and proceed to register.

Select Mode of Payment
Choose a payment option for a secure checkout. You will be redirected accordingly.
Gain insights to stay ahead and seize opportunities.

Get insights & trends for a competitive edge.

Track prices with detailed trend reports.

Analyse trade data for supply chain insights.

Leverage cost reports for smart savings

Enhance supply chain with partnerships.

Connect For More Information
Our expert team of analysts will offer full support and resolve any queries regarding the report, before and after the purchase.
Our expert team of analysts will offer full support and resolve any queries regarding the report, before and after the purchase.
We employ meticulous research methods, blending advanced analytics and expert insights to deliver accurate, actionable industry intelligence, staying ahead of competitors.
Our skilled analysts offer unparalleled competitive advantage with detailed insights on current and emerging markets, ensuring your strategic edge.
We offer an in-depth yet simplified presentation of industry insights and analysis to meet your specific requirements effectively.


Share