

Consumer Insights
Uncover trends and behaviors shaping consumer choices today
Procurement Insights
Optimize your sourcing strategy with key market data
Industry Stats
Stay ahead with the latest trends and market analysis.
Trending Now


The global neon gas market size attained a value of USD 367.59 Million in 2024. The demand for neon gas for producing semiconductor chips is expected to significantly increase in the forecast period. The market for neon gas is highly significant, as it supports a high-tech industries, especially in semiconductor manufacturing, excimer lasers and lithography. Due to its essential role in the fabrication of microchips and its use in different laser technologies, neon gas is the basic component of technological processes used in consumer electronics, telecommunication, and healthcare technology. As several new applications for neon emerged in industries from consumer electronics to the automotive and healthcare sectors, the demand for neon has continued to increase against a backdrop of growing production due to the emergence of 5G networks and electric vehicles and unreliable supply from the former Soviet Union due to the invasion of Ukraine.
Base Year
Historical Year
Forecast Year
Ingas and Cryoin, Ukraine-based rare gas producers, supplied around 45% to 50% of the world’s total neon gas for chip manufacturing in 2021.
For chip production, the global consumption of neon in 2021 reached around 540 metric tons.
Despite being the fifth most abundant element in the universe, neon gas, in the earth’s atmosphere is only available at a concentration of 18 parts per million.
Neon is a chemical element that comes under a group known as ‘noble gases’. These are a group of inert gases which are very stable in nature. Neon is a colourless, odourless gas and is found in trace amounts in the atmosphere. It exhibits a distinct orange-red glow when placed in an electric field.


The supply chain dynamics have gotten more complex with geopolitical factors as the conflict in Ukraine and Russia has been impacting the global supply of neon. By 2022, Ukraine was expected to supply 50% of the world's neon, mostly because to the Soviet steel industry. Both countries are key producers and disruptions in their markets have destabilized global markets, generating further demand for stable neon sources. This demand for neon gas is expected to increase as the industry progresses, particularly for its applications such as medical imaging and laser applications. This growth will be propelled by the growing dependence on neon in various industries, including telecommunications, semiconductor manufacturing, and healthcare applications.
Supply chain disruptions and high production costs have created challenge for the neon gas market. Liberties have been taken to present gases and derivatives as far removed from high-quality materials; extraction technologies are central for providing industrial gas consumption. From its multiple industrial applications to its cardboard future, the neon market's continued expansion will depend on navigating these challenges, according to the U.S. Energy Information Administration.
The neon gas market is important to many industries, from steel production and high-tech manufacturing to medical technologies. However, the COVID-19 pandemic has made high production costs and supply chain disruptions as few approaches to face the market. Production of neon gas is heavily dependent on energy-intensive processes including extraction and purification processes which ultimately increases production cost and energy consumption. Neon is a major consumer-driven element in the steel industry as it is needed for production process quality control and guarantees production expense uniformity. However, energy costs and production costs are still one of the biggest concerns, with the increasing demand for neon gas supply, especially from semiconductor factories. These are tracked by the International Energy Agency, giving consumers an idea of market growth and energy consumption trends. To address these issues, companies are working to enhance extraction methods with quality control and maintain a steady supply of neon gas.
The neon gas industry is picking up pace, fueled by demand from advanced semiconductor manufacturing technologies and data centers. The semiconductor sector is responsible for up to 90% of neon gas laser demand. Neon gas is a key component in the manufacture of microchips, predominantly in extreme ultraviolet (EUV) lithography, a process that is critical for advanced semiconductors and 5G infrastructure. Neon gas is also used in high-purity excimer lasers for AI, IoT, and autonomous vehicles. In 2018, Linde and Praxair announced their merger, accounting for around 70% of U.S. excimer gas output. However, rising consumption of neon gas, coupled with geopolitical factors including supply chain disruptions in specific regions, especially Ukraine and Russia, endangers the availability of the neon gas production sources. As a result, the companies from high-tech industries are looking for alternative production channels for the stable supply of neon gas or boosting recycling capabilities. This trend complements the increasing demand for advanced semiconductor technologies in high-purity neon gas applications. Continued market growth through overcoming supply-side challenges will bolster technological progress across sectors.
Demand for neon gas depends on various supply modes. Cylinders are used for smaller applications, allowing for portability and ease of use. Industries needing larger volumes of neon use bulk and micro bulk supply modes demand for a more useable and cost-effective option for high-consuming operations. Drum tanks are a middle ground solution, providing more storage than cylinders but a smaller requirement than bulk supplies make them ideal for medium-sized needs.
In situations with continued or high-volume demand, such as semiconductor manufacturing and laser applications, on-site supply modes are growing in prevalence. This means neon gas is delivered and stored at the customer site, providing a continuous, always-on supply while eliminating logistics issues. However, each supply mode is designed for certain needs, and the choice of supply model is determined by factors such as production scale, cost-effectiveness, and requirements to operate. Industrial segments as well as Automotive segments change from industry to industry, and can meet a Big Number of demands that we see in all industries, also driving the market high and driving market flexibility high up.
Read more about this report - REQUEST FREE SAMPLE COPY IN PDF
In the field of lasers, neon gas is a vital component specifically in excimer lasers, which have high precision applications in use cases like semiconductors and medical treatments. In signage and lighting neon's capability of emitting bright, vivid colors is widely used for neon signs, and decorative lighting. Neon gas is widely used in microchip manufacturing in the electronics and semiconductor industry, and is an important component in lithography processes.
Neon is used in cooling and refrigeration technologies, benefiting cryogenic applications due to its physical properties. Neon gas creates the necessary atmosphere to manufacture displays in the LCD industry. Moreover, within imaging technologies, neon is critical to some of its most high-resolution technologies, including those used for medical and diagnostic reasons.
Various distribution channels are employed in the market to cater to the different applications in industries. Direct sales are one of the main channels, especially with large-scale customers that are in need of a continuous high-volume supply of neon gas. This model helps provide customized service, client-specific solutions, and long-term contracts with sectors ranging from semiconductor fabrication to medical imaging. Neon gas also gets sold through distributors and wholesalers, who supply the gas to smaller businesses or regional markets. They offer varying quantities and typically cater to a broader set of industries, ranging from signage to electronics.
One of the significant distribution channels is online retail, as it provides the doorstep facilities, especially for those who need small quantities of neon gas or specialized products. This channel allows for ordering simplicity (both via orders and subscription), time-sensitive delivery, and transparent unit pricing, which suit such industries with less predictable demand or specific gas purity level needs.
Neon gas is used across various end-use sectors, stimulating innovation and supporting key technologies. Neon is used in the aerospace and aircraft sector for high-performance lighting and display systems, providing visibility and durability in harsh environments. Neon gas is also used in automotive and transportation equipment for various lighting purposes, including dashboard displays and signaling systems, enhancing both functionality and aesthetics.
The electronics sector is one of the biggest consumers for neon, where it underpins semiconductor production, microchip creation, and the manufacture of high-precision components. Neon’s part in lasers, lithography and other processes provides dependability and performance of electronics. In medicine, another application of neon gas is in medical imaging, specifically in technologies such as magnetic resonance imaging (MRI) and positron emission tomography (PET) scans, where neon serves to create better quality, sharper images for diagnostics. Industries utilizing neon gas range from semiconductor manufacturing to laser technology and lighting. This on-going development of these end use applications promises market growth in the coming years.


North America Neon Gas Market
The neon gas market in North America, particularly in the United States is on a steady rise, with demand coming from high-tech industries including semiconductor manufacturing, medical imaging, and lasers. New demand for ultra-pure neon gas comes from the growing data centers, 5G infrastructure and consumer electronics sectors. Thus, market growth is also fueled by the technological developments and increased use of neon in AI and IoT applications.
Europe Neon Gas Market Trends
D helium backfill as a major factor driving the growth of the neon gas market in Europe. Demand for neon gas used in lasers, lithography and microchip production is driving growth. The Rollout of 5G Networks and emerging next generation technologies are other factors that are driving the market growth.
In the UK, the neon gas market is influenced by its robust industrial sectors, including electronics, healthcare, and aerospace. Demand for high-purity neon for semiconductor production and medical imaging is on the rise, supporting the continued growth of the market.
Asia Pacific Neon Gas Market Trends
The Asia Pacific region's neon gas market is dominated by China, due to the scale of its semiconductor manufacturing and electronics industries. The country’s inroads into rapidly expanding technology sectors, specifically AI, 5G and automotive, are driving neon demand. The continued investment in industrial applications ensures a steady supply of neon gas.
Latin America Neon Gas Market Trends
One of the factors contributing to Latin American neon gas market expansion is the increasing electronics and automotive sector. Demand for high-purity neon is being driven by increased investment in telecommunications and medical technologies. The increase in the end-user industries within the region is bolstering the increased utilization of neon gas for several applications.
Major neon gas suppliers are fulfilling the increasing demand in a wide range of industries, from semiconductor production to medical imaging and telecommunications. These companies ensure a supply of high-purity neon gas as the pipeline suffers from supply chain issues and work on extraction technologies. These top firms are expanding their production capacities with a focus on quality control as well as innovative solutions to meet the diverse demands of various sectors across the globe by adopting alternative sources.
October 2024
Linde revealed plans to acquire two additional large ASUs, more than doubling its on-site capacity. Both ASUs are currently under construction, with the plants slated to be transferred in 2025. Linde has also inked a long-term supply arrangement with Tata Steel for oxygen, nitrogen, and argon to assist the latter's large capacity expansion project.
April 2024
SK hynix announced the successful creation of the industry's first neon gas recycling technology alongside TEMC, a South Korean specialized gas manufacturer for the semiconductor industry. As recent geopolitical turmoil has heightened concern about the import-reliant supply of neon, SK hynix's engagement with local partners aims to address this issue, and has resulted in a substantial accomplishment in just a year.
December 2023
EFC Gases & Advanced Materials (EFC) created a new neon gas recycling technology, which will provide end users with long-term, consistent neon pricing. Cymer, an industrial equipment specialist, has previously validated the Massachusetts-based company's technology for use with excimer lasers.
January 2023
Linde announced the acquisition of the remaining shares in nexAir, LLC, one of the major independent packaged gas distributors in the United States, with estimated 2022 sales of $400 million.
September 2021
Nacero Inc. announced the debut of Nacero NEONTM, a renewable natural gas (RNG) procurement platform. Nacero NEONTM is the strategic growth engine behind Nacero Green GasolineTM, an inexpensive net-zero carbon footprint gasoline for everyday drivers.
The study on the neon gas market delivers detailed analysis on region-level perspective depending on specific contemporary industry trends. It considers various segments, such as supply mode, application, distribution channel, and end use. By assessing all these segments, this report presents a thorough discussion of market drivers, regulations, and emerging opportunities observed in the market.
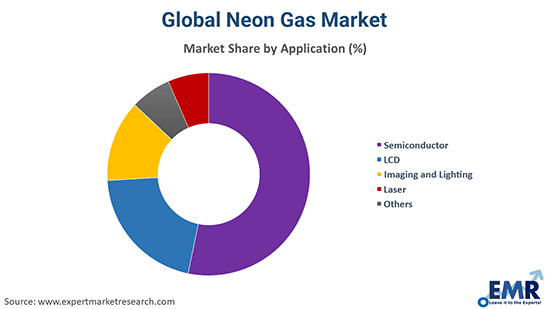
Market Breakup by Application
Market Breakup by End Use
Market Breakup by Supply Mode
Market Breakup by Distribution Channel
Market Breakup by Region
*While we strive to always give you current and accurate information, the numbers depicted on the website are indicative and may differ from the actual numbers in the main report. At Expert Market Research, we aim to bring you the latest insights and trends in the market. Using our analyses and forecasts, stakeholders can understand the market dynamics, navigate challenges, and capitalize on opportunities to make data-driven strategic decisions.*
Get in touch with us for a customized solution tailored to your unique requirements and save upto 35%!
In 2024, the market attained a value of USD 367.59 Million.
The major drivers of the demand in the market include rising disposable incomes, increasing applications in imaging and lighting, and the growing healthcare market.
The key trends in the market are the rapid growth of the semiconductor and consumer electronics sectors and the extensive applications in the aircraft and aerospace sectors.
The major regional markets are North America, Europe, the Asia Pacific, and the rest of the world.
The significant applications of neon gas include semiconductor, LCD, imaging and lighting, and laser, among others.
The different end uses of neon gas include aerospace and aircraft, automotive and transportation equipment, electronics, and healthcare, among others.
Neon is a non-toxic gas owing to its chemically inert nature. It is colourless, odourless, and noncombustible. However, it can act as an asphyxiant if inhaled in large quantities.
The key players in the market are Linde plc, L’Air Liquide S.A. (Air Liquide), Ingas LLC, Cryoin Engineering Ltd., Messer Group GmbH, Matheson Tri-Gas, Inc, Taiyo Nippon Sanso Corporation, Air Products, Iceblick Ltd, Airgas, Inc., Proton Gases, Universal Industrial Gases, Inc, and Electronic Fluorocarbons LLC, among others.
The forecast period for the global neon gas market is from 2025-2034.
Explore our key highlights of the report and gain a concise overview of key findings, trends, and actionable insights that will empower your strategic decisions.
| REPORT FEATURES | DETAILS |
| Base Year | 2024 |
| Historical Period | 2018-2024 |
| Forecast Period | 2025-2034 |
| Scope of the Report |
Historical and Forecast Trends, Industry Drivers and Constraints, Historical and Forecast Market Analysis by Segment:
|
| Breakup by Application |
|
| Breakup by End Use |
|
| Breakup by Supply Mode |
|
| Breakup by Distribution Channel |
|
| Breakup by Region |
|
| Market Dynamics |
|
| Competitive Landscape |
|
| Companies Covered |
|
| Report Price and Purchase Option | Explore our purchase options that are best suited to your resources and industry needs. |
| Delivery Format | Delivered as an attached PDF and Excel through email, with an option of receiving an editable PPT, according to the purchase option. |
Datasheet
One User
USD 2,499
USD 2,249
tax inclusive*
Single User License
One User
USD 3,999
USD 3,599
tax inclusive*
Five User License
Five User
USD 4,999
USD 4,249
tax inclusive*
Corporate License
Unlimited Users
USD 5,999
USD 5,099
tax inclusive*
*Please note that the prices mentioned below are starting prices for each bundle type. Kindly contact our team for further details.*
Flash Bundle
Small Business Bundle
Growth Bundle
Enterprise Bundle
*Please note that the prices mentioned below are starting prices for each bundle type. Kindly contact our team for further details.*
Flash Bundle
Number of Reports: 3
20%
tax inclusive*
Small Business Bundle
Number of Reports: 5
25%
tax inclusive*
Growth Bundle
Number of Reports: 8
30%
tax inclusive*
Enterprise Bundle
Number of Reports: 10
35%
tax inclusive*
How To Order
Our step-by-step guide will help you select, purchase, and access your reports swiftly, ensuring you get the information that drives your decisions, right when you need it.

Select License Type
Choose the right license for your needs and access rights.

Click on ‘Buy Now’
Add the report to your cart with one click and proceed to register.

Select Mode of Payment
Choose a payment option for a secure checkout. You will be redirected accordingly.
Track prices with detailed trend reports.

Analyse trade data for supply chain insights.

Leverage cost reports for smart savings

Enhance supply chain with partnerships.

Gain insights to stay ahead and seize opportunities.

Get insights & trends for a competitive edge.

Track prices with detailed trend reports.
Analyse trade data for supply chain insights.
Leverage cost reports for smart savings
Enhance supply chain with partnerships.
Gain insights to stay ahead and seize opportunities.
Get insights & trends for a competitive edge.
Track prices with detailed trend reports.
Analyse trade data for supply chain insights.
Connect For More Information
Our expert team of analysts will offer full support and resolve any queries regarding the report, before and after the purchase.
Our expert team of analysts will offer full support and resolve any queries regarding the report, before and after the purchase.
We employ meticulous research methods, blending advanced analytics and expert insights to deliver accurate, actionable industry intelligence, staying ahead of competitors.
Our skilled analysts offer unparalleled competitive advantage with detailed insights on current and emerging markets, ensuring your strategic edge.
We offer an in-depth yet simplified presentation of industry insights and analysis to meet your specific requirements effectively.
Australia
63 Fiona Drive, Tamworth, NSW
+61-448-061-727
India
C130 Sector 2 Noida, Uttar Pradesh 201301
+91-723-689-1189
Philippines
40th Floor, PBCom Tower, 6795 Ayala Avenue Cor V.A Rufino St. Makati City,1226.
+63-287-899-028, +63-967-048-3306
United Kingdom
6 Gardner Place, Becketts Close, Feltham TW14 0BX, Greater London
+44-753-713-2163
United States
30 North Gould Street, Sheridan, WY 82801
+1-415-325-5166
Vietnam
193/26/4 St.no.6, Ward Binh Hung Hoa, Binh Tan District, Ho Chi Minh City
+84-865-399-124
United States (Head Office)
30 North Gould Street, Sheridan, WY 82801
+1-415-325-5166
Australia
63 Fiona Drive, Tamworth, NSW
+61-448-061-727
India
C130 Sector 2 Noida, Uttar Pradesh 201301
+91-723-689-1189
Philippines
40th Floor, PBCom Tower, 6795 Ayala Avenue Cor V.A Rufino St. Makati City, 1226.
+63-287-899-028, +63-967-048-3306
United Kingdom
6 Gardner Place, Becketts Close, Feltham TW14 0BX, Greater London
+44-753-713-2163
Vietnam
193/26/4 St.no.6, Ward Binh Hung Hoa, Binh Tan District, Ho Chi Minh City
+84-865-399-124


Share