

Consumer Insights
Uncover trends and behaviors shaping consumer choices today
Procurement Insights
Optimize your sourcing strategy with key market data
Industry Stats
Stay ahead with the latest trends and market analysis.
Trending Now


The global narrowband-IoT market was valued to reach a market size of USD 1926.48 Million in 2024. The industry is expected to grow at a CAGR of 35.00% during the forecast period of 2025-2034. The growth in demand for low-power, cost-effective connectivity solutions in smart city applications, industrial IoT, healthcare, and agriculture is a key driver of the narrowband IoT market, allowing efficient data transmission across wide geographic areas, thus aiding the market growth to attain a valuation of USD 38734.88 Million by 2034.
Base Year
Historical Year
Forecast Year


Value in USD Million
2025-2034
Narrowband-IoT Market Outlook
*this image is indicative*
The narrowband IoT market is soon to expand as LPWAN technologies are customized for energy and cost-efficient applications in IoT, underpinning its growth. Its ability to provide seamless connectivity in hard-to-reach places makes it indispensable to industries such as utilities, retail, and transportation.
The key drivers include regulatory support for IoT development, increasing penetration of smart utilities such as water and gas meters, and scalable solutions that help support industrial digitization. This is a value proposition for business-to-business operations as it ensures low power consumption and affordability, therefore providing long-term operational efficiencies, thereby boosting the growth of narrowband-IoT market.
Emerging trends include increasing adoption in e-health and wearable devices catered to the growing healthcare needs. Its application in disaster management, environmental monitoring showcases the ability to handle some of the challenges posed at the global level. Hybrid solutions incorporating NB-IoT with other wireless technologies are further expanding use cases.
The leading market players, Ericsson, Nokia, and ZTE, are expanding their NB-IoT portfolios through partnerships with telecom operators and IoT solution providers. Network deployments are ramping up in those regions that are pioneering smart city and industrial IoT adoption, such as Asia-Pacific and Europe. The market will morph, unlocking transformative benefits across connected ecosystems.


With the advancing narrowband-IoT technology, its adoption is growing rapidly in various applications. The enhanced design and improved narrowband-IoT devices and roll-out services, the technology companies and telecommunications service providers are investing more in the product, which is expected to boost the demand of narrowband-IoT market over the forecast period.
Further, the developments in artificial intelligence (AI), machine learning (ML), and big data analytics will allow companies to analyse the vast volumes of data collected from tracking and monitoring activities using narrowband-IoT networks. Thus, it is anticipated that the growing adoption of IoT and connected devices, along with machine learning and big data analytics through industrial and commercial applications, will lead to the narrowband-IoT market growth in the forecast period.
The narrowband IoT market trends include 5G integration, smart utility adoption, rural connectivity expansion, and healthcare applications, driving innovation in diverse IoT use cases globally.
NB-IoT is becoming integrated with 5G to add connectivity, reliability, and scalability. This is important for large IoT deployments where low latency, high capacity can be offered in combination with NB-IoT cost efficiency and power consumption. China Mobile uses the deployment of NB-IoT on its 5G network infrastructure to promote smart agriculture; in this context, real-time soil conditions and crop health over thousands of hectares could be monitored. This trend is particularly relevant for industrial IoT and smart cities, where seamless connectivity for millions of devices is crucial for efficient operations, thus augmenting the Narrowband-IoT demand growth.
Smart utilities, including water, gas, and electricity management, increasingly adopt NB-IoT for real-time data collection and monitoring. NB-IoT-enabled smart meters enhance efficiency by reducing manual labor and detecting anomalies early. For example, Vodafone collaborated with Techem in deploying NB-IoT-capable water meters across Europe. These devices can provide utilities with accurate consumption details and allow the end-users to monitor their use in real time, which matches the sustainability objectives. This is highly influenced by energy-saving and resource utilization, factors that are greatly needed in an urban and industrial environment.
It has potential as a solution that will help connect devices in many remote areas in which traditional cellular networks fail. Additionally, it provides reliable coverage with minimal power and hence is mainly suitable for agriculture and wildlife monitoring. For instance, Huawei has implanted NB-IoT-based tracking collars for elephants in Africa to handle the cases of poaching besides studying the migration pattern of these animals. This trend demonstrates how the technology may be used to solve global challenges such as food security and environmental conservation, thereby boosting the narrowband-IoT market revenue.
Narrowband-IoT adoption is growing in healthcare for wearable devices and remote patient monitoring. These solutions can continuously track health metrics in a minimal way, considering battery consumption. For instance, Medtronic developed NB-IoT-enabled wearable glucose monitors for diabetes patients offering real-time updates to doctors and caregivers. The trend, therefore, resonates with the rising demand for telemedicine and personalized healthcare where reliable, low-cost connectivity is sure to deliver accessibility and improved patient outcomes, particularly in underserved regions.
Research conducted by Omdia stated that the landscape of Low Power Wide Area Network (LPWAN) Internet of Things (IoT) connections is predominantly influenced by NB-IoT and LoRa, which represented 87% of total connections in 2023. This trend is anticipated to continue with these two technologies projected to account for 86% of all LPWAN connections by 2030. The major narrowband-IoT demand is largely attributed to its widespread adoption in China, whereas LoRaWAN is the preferred choice in most other regions. Both technologies are well-suited for the mid-range IoT applications that are currently in demand.
NB-IoT is expected to grow through cost-effective implementations and reach a high growth rate by 2030. Despite being the leading LPWAN technology, over 90% of NB-IoT connections are concentrated in China. However, it is anticipated that NB-IoT will gain traction in Europe following its launch in 2023, as several service providers begin deploying satellite-based NB-IoT connectivity to fill coverage gaps in remote areas.
Growing Adoption in Smart Cities
Smart city initiatives are increasingly relying on NB-IoT for various applications such as smart parking solutions, street lighting, waste management, and environmental monitoring. The long-range, low-power capabilities of NB-IoT make it especially effective for connecting a multitude of urban sensors, which improves city management and optimises resource use, contributing to the narrowband-IoT market revenue. For instance, Barcelona leverages NB-IoT technology to improve its waste management system. Sensors placed in waste containers monitor fill levels and send real-time data, enabling the city to optimise garbage collection routes, reduce operational costs, and lessen environmental impact.
Shanghai has also implemented smart parking systems that leverage NB-IoT technology. These sensors identify available parking spaces and transmit this information to a centralised system, thereby assisting drivers in finding parking more effectively and increasing traffic congestion. Additionally, the city employs NB-IoT to manage street lighting, optimising energy usage by adjusting illumination levels according to real-time data, including pedestrian activity and traffic patterns.
Increased Expansion of Smart Utilities
The adoption of smart meters for electricity, gas, and water is gaining popularity in recent years. Several utility companies are increasingly leveraging NB-IoT technology for real-time monitoring and data analysis, leading to better resource management and more accurate billing, which can fuel narrowband-IoT market value. This sector presents a substantial growth opportunity as utilities aim to enhance their operational efficiency.
The United States has one of the most advanced smart meter markets in the world, where forecasts suggested that by the end of 2023, 76% of electricity meters were going to be smart. Major cities like New York and Los Angeles have effectively rolled out smart meter installations for both electricity and gas consumption. Moreover, major utility providers such as Pacific Gas and Electric and Con Edison are leading these efforts, employing smart meters to provide real-time data and enhance demand management.
The costs involved in deploying NB-IoT infrastructure can be quite significant, particularly for smaller telecom providers. In many regions, setting up dedicated NB-IoT networks requires substantial investments in both technology and spectrum licensing. According to data from IoT Analytics, network operators in areas like Latin America and Africa have been slow to adopt NB-IoT due to the challenges associated with initial expenses, which can impact narrowband-IoT demand forecast.
Additionally, NB-IoT faces strong competition from other low-power wide-area (LPWA) network technologies, such as LoRaWAN and Sigfox. These alternatives often target similar applications while offering more flexibility in terms of network ownership and deployment methods. For instance, LoRaWAN is often used in private networks, allowing businesses to function independently of telecom operators, which reduces the appeal of NB-IoT in certain markets. As a result, LoRaWAN continues to hold a dominant position outside of China, where NB-IoT is more widely used.
Read more about this report - REQUEST FREE SAMPLE COPY IN PDF
“Narrowband-IoT Market Report and Forecast 2025-2034” offers a detailed analysis of the market based on the following segments:
Market Breakup by Type:
Market Breakup by Deployment Mode:
Market Breakup by Device Type:
Market Breakup by End-Use:
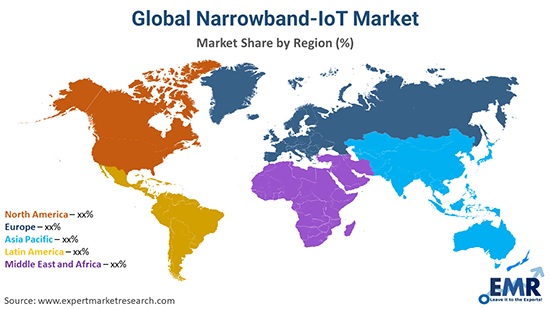
Market Breakup by Region:
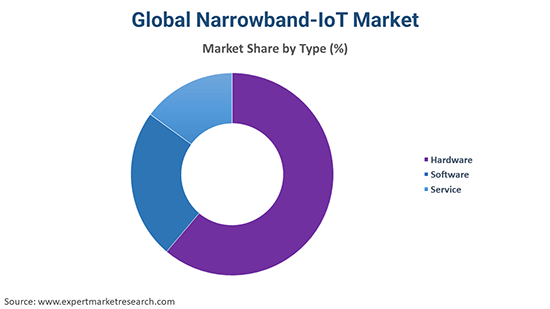
By Type Insights
Hardware includes essential components like NB-IoT modules, sensors, and devices, which are critical for deploying IoT solutions across various industries. As NB-IoT is used for smart meters, sensors, and tracking devices, the demand for these hardware products is high. As per the narrowband-IoT market dynamics and trends, the initial deployment of NB-IoT networks requires significant investment in hardware infrastructure, such as base stations and network modules, which drives the share of hardware higher than software or services.
By Deployment Mode Insights
n-Band NB-IoT uses the existing LTE (4G) spectrum, which allows telecom operators to deploy NB-IoT within their current cellular infrastructure without needing new spectrum resources. This makes it cost-effective and easier to implement compared to the other options. Guard Band NB-IoT is also used within the LTE network but in the unused portion of the spectrum. It has a smaller share compared to In-Band since not all networks have enough guard band space.
By Device Type Insights
Smart meters (for electricity, water, and gas) account for a major narrowband-IoT market share because they are widely deployed by utility companies for real-time monitoring and management of resources. NB-IoT enables cost-effective, energy-efficient, and long-range communication for millions of smart meters, making it a key application of the technology.
Trackers for asset tracking and logistics also hold a significant share. These include applications in fleet management, supply chain logistics, and personal asset tracking. NB-IoT’s low power consumption and long-range communication are ideal for tracking devices in various industries, especially in transportation and logistics.
By End Use Insights
The Energy and Utilities sector has the highest share due to the widespread deployment of smart meters for electricity, water, and gas monitoring. NB-IoT is extensively used by utility companies for real-time data collection, monitoring, and management, making it a critical part of the sector’s infrastructure.
The Automotive and Transportation sector also holds a significant share, driven by applications like asset tracking, fleet management, and vehicle monitoring. NB-IoT enables cost-efficient and reliable communication for tracking vehicles and goods across long distances, making it essential in logistics and transportation.
Read more about this report - REQUEST FREE SAMPLE COPY IN PDF
North America Narrowband-IoT Market Trends
In North America, the growth of the narrowband-IoT industry is primarily driven by strong smart city initiatives, improvements in utility modernisation like smart meters, and advancements in the healthcare sector. Cities such as New York and San Francisco are integrating NB-IoT into smart grids, intelligent parking systems, and utility monitoring solutions. Additionally, regulatory support for energy-efficient technologies is promoting the uptake of NB-IoT, especially in utilities and infrastructure management. The Federal Communications Commission (FCC) in the USA has supported the rollout of IoT technologies by allocating spectrum, which had a positive impact on NB-IoT applications.
Asia Pacific Narrowband-IoT Market Growth
The Asia Pacific is expected to lead the global market over the forecast period owing to the growing adoption of advanced technology in the region. The Asia-Pacific region, particularly China and India, is the largest and fastest-growing market for Narrowband Internet of Things (NB-IoT). As per the narrowband-IoT industry analysis, China leads the world in NB-IoT adoption, with extensive implementations in smart cities, smart agriculture, and utility services. India is also making notable progress through its ambitious projects in smart metering and the development of utility infrastructure.
In 2023, China accounted for over 60% of global NB-IoT connections, driven by significant investments in smart infrastructure. Meanwhile, India's Smart Meter National Program aims to install more than 250 million smart meters using NB-IoT technology by 2025.
Europe Narrowband-IoT Market Drivers
Europe has readily advocated for energy efficiency and environmental sustainability, leading to the widespread adoption of NB-IoT across various applications such as smart metering, environmental monitoring, and waste management, that can boost narrowband-IoT demand growth.
Moreover, Italy was among the top countries in Europe to implement smart meters on a large scale, especially for electricity usage. Major cities such as Rome and Milan have achieved nearly complete coverage with smart meters, which offer valuable data on energy consumption, facilitate remote monitoring and management, and further boost the demand for narrowband IoT.
Middle East and Africa Narrowband-IoT Market Overview
In the Middle East, countries such as Saudi Arabia and the UAE, NB-IoT is being utilised to enhance smart city initiatives and modernise utility services. Meanwhile, in Africa, this technology is increasingly being adopted in sectors such as agriculture, healthcare, and utility management, providing an energy-efficient alternative for remote regions and enhancing narrowband-IoT market opportunities.
Saudi Arabia's Saudi Electricity Company (SEC) effectively installed more than 11 million smart electricity meters throughout the kingdom. Major cities, including Riyadh and Jeddah, are now entirely equipped with these advanced meters, facilitating their progress towards their energy efficiency objectives.
Latin America Narrowband-IoT Market Outlook
In Latin America, the adoption of NB-IoT is driven by the demand for improved infrastructure management, especially within utility services and smart city initiatives. Countries such as Brazil and Mexico are increasing investments into NB-IoT to enhance utility systems and implement more energy-efficient infrastructures, which can fuel the narrowband-IoT industry revenue.
While regional market growth is not as high as North America and Europe, there has still been a consistent rise in its adoption, particularly in Brazil, where NB-IoT technology is utilised for smart metering and agricultural monitoring.
The report presents a detailed analysis of the following key players in the global narrowband-IoT industry, looking into their capacity, market shares, and latest developments like capacity expansions, plant turnarounds, and mergers and acquisitions. Companies are using NB-IoT for smart city infrastructure like smart parking, street lighting, and waste management. By using NB-IoT, devices can operate with minimal energy consumption while connecting to central systems over long distances. For example, they offer smart metering and street lighting control systems using NB-IoT technology, improving energy efficiency and real-time monitoring.
Huawei is a Chinese multinational technology company, founded in 1987, known for its telecommunications equipment and consumer electronics. It is one of the largest manufacturers of smartphones and networking equipment globally.
Qualcomm is an American multinational corporation headquartered in San Diego, California. It is a leader in the semiconductor industry, especially known for designing and manufacturing wireless telecommunications products and services.
Nordic Semiconductor is a Norwegian company that specializes in designing and manufacturing integrated circuits, particularly in the area of low-power wireless communication. It is a major player in the Internet of Things (IoT) industry, providing Bluetooth Low Energy (BLE) solutions and other wireless technologies for connected devices.
*Please note that this is only a partial list; the complete list of key players is available in the full report. Additionally, the list of key players can be customized to better suit your needs.*
Other major players in the market are Samsung Electronics Co., Ltd., Riot Micro, Intel Corporation, MediaTek Inc., ZTE Corporation, and Shenzhen Goodix Technology Co., Ltd., among others.
*While we strive to always give you current and accurate information, the numbers depicted on the website are indicative and may differ from the actual numbers in the main report. At Expert Market Research, we aim to bring you the latest insights and trends in the market. Using our analyses and forecasts, stakeholders can understand the market dynamics, navigate challenges, and capitalize on opportunities to make data-driven strategic decisions.*
Get in touch with us for a customized solution tailored to your unique requirements and save upto 35%!
In 2024, the market reached an approximate value of USD 1926.48 Million.
The narrowband-IoT market is assessed to grow at a CAGR of 35.00% between 2025 and 2034.
The major drivers of the market include rising urbanisation, enhanced design and improved narrowband-IoT devices and roll-out services, increased investments by technology companies and telecommunications service providers, and enhanced preference for energy-efficient narrowband-IoT modules.
Developments in artificial intelligence (AI), machine learning (ML), and big data analytics which will allow analysis of vast volumes of data collected from narrowband-IoT networks are the key trends propelling the growth of the market.
The major regions in the market are North America, Latin America, the Middle East and Africa, Europe, and the Asia Pacific, with North America accounting for the largest share in the market.
The types can be divided into hardware, software, and service.
Stand-alone, guard band and in-band are the major deployment modes of this market. The guard band segment is a dominant deployment mode of narrowband-IoT in the market.
The device types in the global narrowband-IoT market include smart parking, smart meters, trackers, alarms and detectors, smart streetlights, smart appliances, and wearable devices, among others.
The end-use sectors include agriculture, automotive and transportation, energy and utilities, healthcare, manufacturing, safety and security, and infrastructure, among others.
The major players in the market are Huawei Technologies Co., Ltd., Qualcomm Technologies, Inc., Nordic Semiconductor ASA, Samsung Electronics Co., Ltd., Riot Micro, Intel Corporation, MediaTek Inc., ZTE Corporation, and Shenzhen Goodix Technology Co., Ltd., among others.
The market is estimated to witness healthy growth in the forecast period of 2025-2034 to reach a value of around USD 38734.88 Million by 2034.
Explore our key highlights of the report and gain a concise overview of key findings, trends, and actionable insights that will empower your strategic decisions.
| REPORT FEATURES | DETAILS |
| Base Year | 2024 |
| Historical Period | 2018-2024 |
| Forecast Period | 2025-2034 |
| Scope of the Report |
Historical and Forecast Trends, Industry Drivers and Constraints, Historical and Forecast Market Analysis by Segment:
|
| Breakup by Type |
|
| Breakup by Deployment Mode |
|
| Breakup by Device Type |
|
| Breakup by End Use |
|
| Breakup by Region |
|
| Market Dynamics |
|
| Competitive Landscape |
|
| Companies Covered |
|
| Report Price and Purchase Option | Explore our purchase options that are best suited to your resources and industry needs. |
| Delivery Format | Delivered as an attached PDF and Excel through email, with an option of receiving an editable PPT, according to the purchase option. |
Datasheet
One User
USD 2,499
USD 2,249
tax inclusive*
Single User License
One User
USD 3,999
USD 3,599
tax inclusive*
Five User License
Five User
USD 4,999
USD 4,249
tax inclusive*
Corporate License
Unlimited Users
USD 5,999
USD 5,099
tax inclusive*
*Please note that the prices mentioned below are starting prices for each bundle type. Kindly contact our team for further details.*
Flash Bundle
Small Business Bundle
Growth Bundle
Enterprise Bundle
*Please note that the prices mentioned below are starting prices for each bundle type. Kindly contact our team for further details.*
Flash Bundle
Number of Reports: 3
20%
tax inclusive*
Small Business Bundle
Number of Reports: 5
25%
tax inclusive*
Growth Bundle
Number of Reports: 8
30%
tax inclusive*
Enterprise Bundle
Number of Reports: 10
35%
tax inclusive*
How To Order
Our step-by-step guide will help you select, purchase, and access your reports swiftly, ensuring you get the information that drives your decisions, right when you need it.

Select License Type
Choose the right license for your needs and access rights.

Click on ‘Buy Now’
Add the report to your cart with one click and proceed to register.

Select Mode of Payment
Choose a payment option for a secure checkout. You will be redirected accordingly.
Gain insights to stay ahead and seize opportunities.

Get insights & trends for a competitive edge.

Track prices with detailed trend reports.

Analyse trade data for supply chain insights.

Leverage cost reports for smart savings

Enhance supply chain with partnerships.

Connect For More Information
Our expert team of analysts will offer full support and resolve any queries regarding the report, before and after the purchase.
Our expert team of analysts will offer full support and resolve any queries regarding the report, before and after the purchase.
We employ meticulous research methods, blending advanced analytics and expert insights to deliver accurate, actionable industry intelligence, staying ahead of competitors.
Our skilled analysts offer unparalleled competitive advantage with detailed insights on current and emerging markets, ensuring your strategic edge.
We offer an in-depth yet simplified presentation of industry insights and analysis to meet your specific requirements effectively.
Australia
63 Fiona Drive, Tamworth, NSW
+61-448-061-727
India
C130 Sector 2 Noida, Uttar Pradesh 201301
+91-723-689-1189
Philippines
40th Floor, PBCom Tower, 6795 Ayala Avenue Cor V.A Rufino St. Makati City,1226.
+63-287-899-028, +63-967-048-3306
United Kingdom
6 Gardner Place, Becketts Close, Feltham TW14 0BX, Greater London
+44-753-713-2163
United States
30 North Gould Street, Sheridan, WY 82801
+1-415-325-5166
Vietnam
193/26/4 St.no.6, Ward Binh Hung Hoa, Binh Tan District, Ho Chi Minh City
+84-865-399-124
United States (Head Office)
30 North Gould Street, Sheridan, WY 82801
+1-415-325-5166
Australia
63 Fiona Drive, Tamworth, NSW
+61-448-061-727
India
C130 Sector 2 Noida, Uttar Pradesh 201301
+91-723-689-1189
Philippines
40th Floor, PBCom Tower, 6795 Ayala Avenue Cor V.A Rufino St. Makati City, 1226.
+63-287-899-028, +63-967-048-3306
United Kingdom
6 Gardner Place, Becketts Close, Feltham TW14 0BX, Greater London
+44-753-713-2163
Vietnam
193/26/4 St.no.6, Ward Binh Hung Hoa, Binh Tan District, Ho Chi Minh City
+84-865-399-124


Share