

Consumer Insights
Uncover trends and behaviors shaping consumer choices today
Procurement Insights
Optimize your sourcing strategy with key market data
Industry Stats
Stay ahead with the latest trends and market analysis.

The global mobile augmented reality market size is expected to grow at a CAGR of 3.30% between 2026 and 2035. The major market drivers include increasing application of mobile augmented reality in retail, rising adoption by enterprises, and rapid development of mobile augmented reality applications.
Base Year
Historical Period
Forecast Period
Compound Annual Growth Rate
3.3%
2026-2035
*this image is indicative*
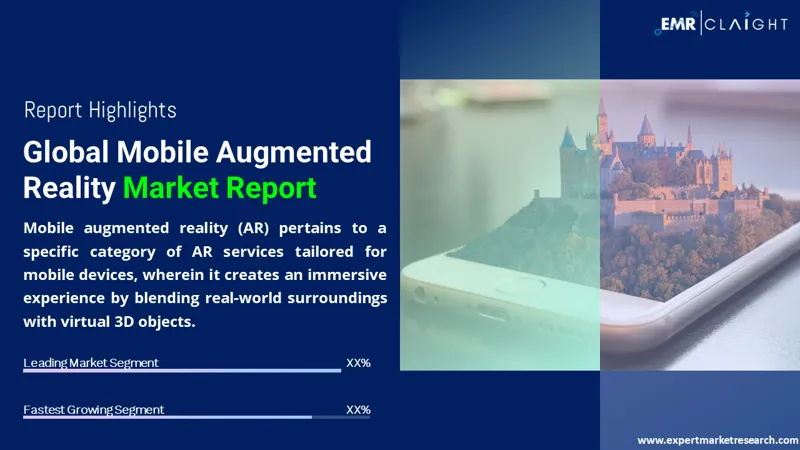
Mobile augmented reality refers to a type of augmented reality (AR) service designed for mobiles devices which simulates an environment containing real and virtual 3D objects. This type of technology alters the natural environment to expand the information base for users.
Read more about this report - REQUEST FREE SAMPLE COPY IN PDF
Read more about this report - REQUEST FREE SAMPLE COPY IN PDF
The EMR’s report titled “Mobile Augmented Reality Market Report and Forecast 2026-2035" offers a detailed analysis of the market based on the following segments:
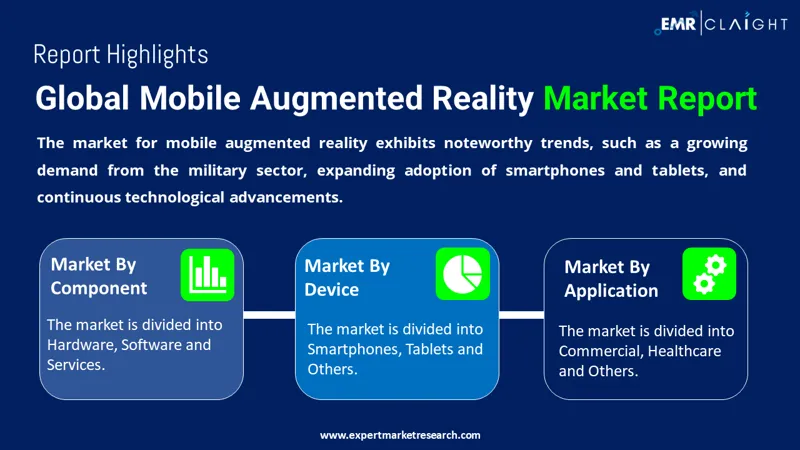
Market Breakup by Component
Market Breakup by Device
Market Breakup by Application
Market Breakup by Region


The smartphones segments, based on device, accounts for a sizable share of the mobile augmented reality market, supported by the widespread penetration of smartphones and high compatibility of mobile augmented reality with Android and iOS operating systems. Advancements in smartphone technology and reducing costs of basic smartphones are increasing their purchase worldwide, while development of new apps are drawing the interest of consumers towards mobile AR. In addition, common standards are likely to be established which will facilitate AR use in all smartphones, further increasing the market share of smartphones.
The aerospace and defence sector, based on application, accounts for a significant share of the mobile augmented reality market. Mobile augmented reality is increasingly being used in aerospace to provide training to pilots and other personnel. Flight simulations supported by mobile augmented reality aid new pilots in gaining proficiency in flying and help experienced pilots practice new systems and plane types.
In the military sector, mobile augmented reality helps provide a wide range of training to military personnel, recreating various scenarios the military personnel may face. Mobile augmented reality offers a safe yet effective means of training in aerospace and defence applications, due to which is it is widely being adopted in these sectors.
The comprehensive EMR report provides an in-depth assessment of the market based on the Porter's five forces model along with giving a SWOT analysis. The report gives a detailed analysis of the key players in the global mobile augmented reality market, covering their competitive landscape and latest developments like mergers, acquisitions, investments and expansion plans.
Samsung Electronics Co., Ltd. is a leading electronics company which offers services related to consumer electronics, IT and mobile communications, and device solutions. The company was founded in 1969 and is headquartered in Suwon-Si, South Korea.
Blippar Group Limited is a technology content company which provides solutions and tools for augmented reality. Established in 2019 and headquartered in London, United Kingdom, this company is dedicated towards improving the accessibility of AR across the world.
ScienceSoft USA Corporation is a provider of IT consultation and custom software development services. Founded in 1989 and headquartered in Texas in the United States, ScienceSoft also offers services related to data analytics and cybersecurity.
*Please note that this is only a partial list; the complete list of key players is available in the full report. Additionally, the list of key players can be customized to better suit your needs.*
Other market players include Google LLC, Apple Inc., Magic Leap, Inc., Qualcomm Technologies, Inc., iTechArt Group, Inc., Microsoft Corporation, Groove Jones LLC, ImagineAR, and Marxent Labs LLC, among others.


Upto 15% Off
USD
$2499 $2249
$3999 $3599
$4999 $4249
$5999 $5099


*While we strive to always give you current and accurate information, the numbers depicted on the website are indicative and may differ from the actual numbers in the main report. At Expert Market Research, we aim to bring you the latest insights and trends in the market. Using our analyses and forecasts, stakeholders can understand the market dynamics, navigate challenges, and capitalize on opportunities to make data-driven strategic decisions.*
Get in touch with us for a customized solution tailored to your unique requirements and save upto 35%!
The market is estimated to grow at a CAGR of 3.30% between 2026 and 2035.
The increasing applications of mobile augmented reality in e-commerce and retail, rising adoption by enterprises to enhance business profitability, and rapid development of mobile augmented reality applications are the major drivers of the market.
The key trends in the market include the rising demand for mobile augmented reality from the military sector, increasing penetration of smartphones and tablets, and technological advancements.
Hardware, software, and services are the different components of mobile augmented reality in the market, with hardware further divided based on type into 3D camera, sensors, and processor, among others.
North America, Europe, Asia Pacific, Latin America, and the Middle East and Africa are the major regions of the market.
Smartphones, tablets, and personal digital assistants (PDAs), among others, are the major devices of mobile augmented reality in the market.
Consumer, enterprise, commercial, healthcare, and aerospace and defence, among others, are the significant applications of mobile augmented reality in the market.
Samsung Electronics Co., Ltd., Blippar Group Limited, ScienceSoft USA Corporation, Google LLC, Apple Inc., Magic Leap, Inc., Qualcomm Technologies, Inc., iTechArt Group, Inc., Microsoft Corporation, Groove Jones LLC, ImagineAR, and Marxent Labs LLC, among others, are the key mobile augmented reality market players, according to the report.
Explore our key highlights of the report and gain a concise overview of key findings, trends, and actionable insights that will empower your strategic decisions.
| REPORT FEATURES | DETAILS |
| Base Year | 2025 |
| Historical Period | 2019-2025 |
| Forecast Period | 2026-2035 |
| Scope of the Report |
Historical and Forecast Trends, Industry Drivers and Constraints, Historical and Forecast Market Analysis by Segment:
|
| Breakup by Component |
|
| Breakup by Device |
|
| Breakup by Application |
|
| Breakup by Region |
|
| Market Dynamics |
|
| Competitive Landscape |
|
| Companies Covered |
|
Datasheet
One User
USD 2,499
USD 2,249
tax inclusive*
Single User License
One User
USD 3,999
USD 3,599
tax inclusive*
Five User License
Five User
USD 4,999
USD 4,249
tax inclusive*
Corporate License
Unlimited Users
USD 5,999
USD 5,099
tax inclusive*
*Please note that the prices mentioned below are starting prices for each bundle type. Kindly contact our team for further details.*
Flash Bundle
Small Business Bundle
Growth Bundle
Enterprise Bundle
*Please note that the prices mentioned below are starting prices for each bundle type. Kindly contact our team for further details.*
Flash Bundle
Number of Reports: 3
20%
tax inclusive*
Small Business Bundle
Number of Reports: 5
25%
tax inclusive*
Growth Bundle
Number of Reports: 8
30%
tax inclusive*
Enterprise Bundle
Number of Reports: 10
35%
tax inclusive*
How To Order

Select License Type
Choose the right license for your needs and access rights.

Click on ‘Buy Now’
Add the report to your cart with one click and proceed to register.

Select Mode of Payment
Choose a payment option for a secure checkout. You will be redirected accordingly.
Gain insights to stay ahead and seize opportunities.

Get insights & trends for a competitive edge.

Track prices with detailed trend reports.

Analyse trade data for supply chain insights.

Leverage cost reports for smart savings

Enhance supply chain with partnerships.

Connect For More Information
Our expert team of analysts will offer full support and resolve any queries regarding the report, before and after the purchase.
Our expert team of analysts will offer full support and resolve any queries regarding the report, before and after the purchase.
We employ meticulous research methods, blending advanced analytics and expert insights to deliver accurate, actionable industry intelligence, staying ahead of competitors.
Our skilled analysts offer unparalleled competitive advantage with detailed insights on current and emerging markets, ensuring your strategic edge.
We offer an in-depth yet simplified presentation of industry insights and analysis to meet your specific requirements effectively.


Share