

Consumer Insights
Uncover trends and behaviors shaping consumer choices today
Procurement Insights
Optimize your sourcing strategy with key market data
Industry Stats
Stay ahead with the latest trends and market analysis.

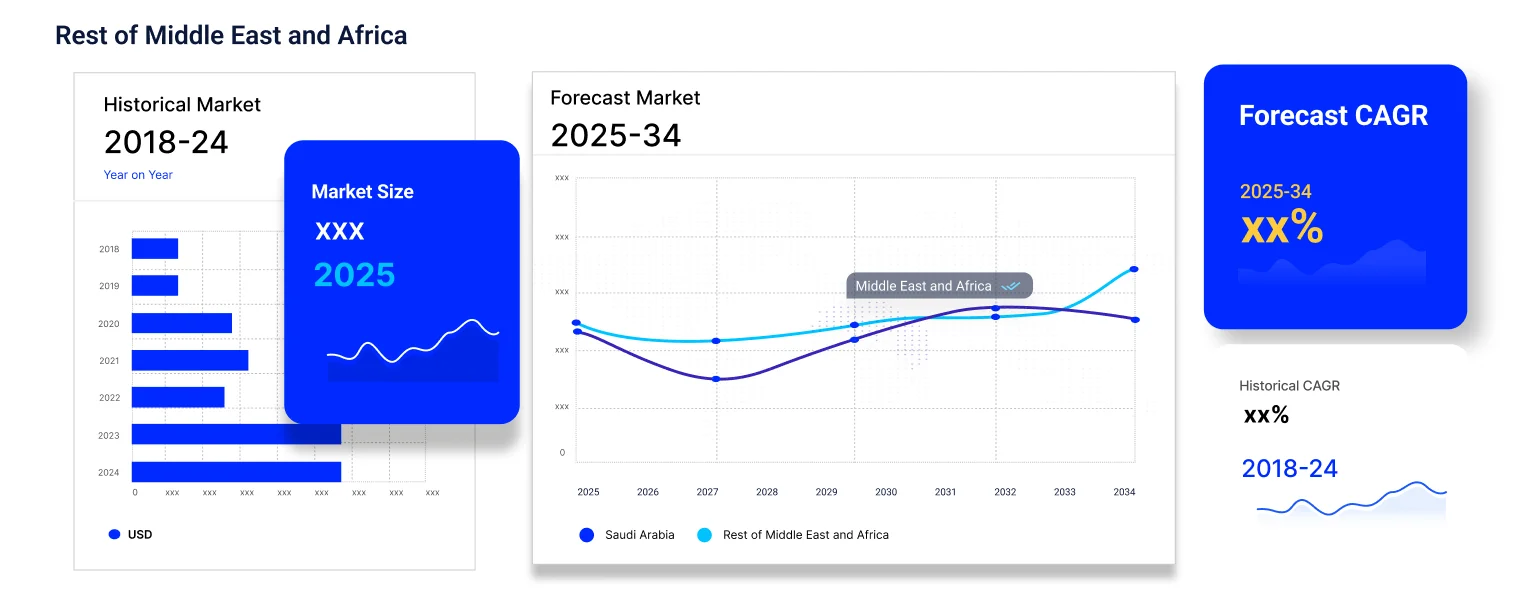
The Middle East and Africa vibration sensors market size is projected to grow at a CAGR of 5.60% between 2026 and 2035. Rapid industrialisation and the increasing demand for vibration sensors from the automotive sector are expected to drive the market in the forecast period.
Base Year
Historical Period
Forecast Period
Quartz is expected to dominate the market for manufacturing vibration sensors in the Middle East and Africa region.
The demand for displacement sensors is expected to record significant growth over the forecast period.
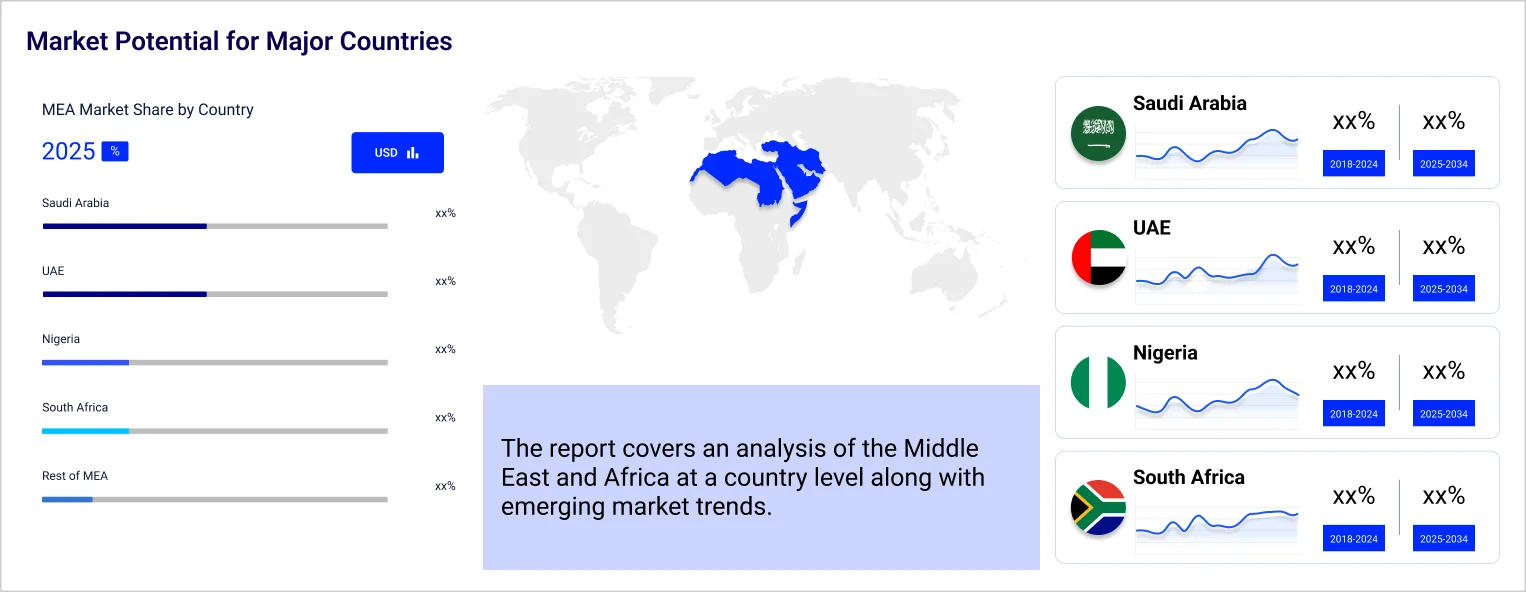
The United Arab Emirates is expected to constitute a major portion of the Middle East and Africa vibration sensors market share.
Compound Annual Growth Rate
5.6%
2026-2035
*this image is indicative*
The anticipated growth of the natural gas industry in the Middle East is expected to surge the demand for vibration sensors in the region. This is because they play an integral role in the maintenance of gearboxes, motors, compressors, and other critical components involved in the extraction and processing of raw energy. This is expected to drive the Middle East and Africa vibration sensors market growth.
The multifunctional uses of displacement sensors are expected to make them increasingly popular over the forecast period. This includes their application in agricultural machinery and motorsport vehicles, industrial conveyors and labelling machines, and oncology machines and MRI equipment. They are also integrated with CCTV cameras to monitor their angle, give special effects in TV shows and movies, and move ramps and bridges to enhance infrastructural safety. This is expected to result in the Middle East and Africa vibration sensors market development.
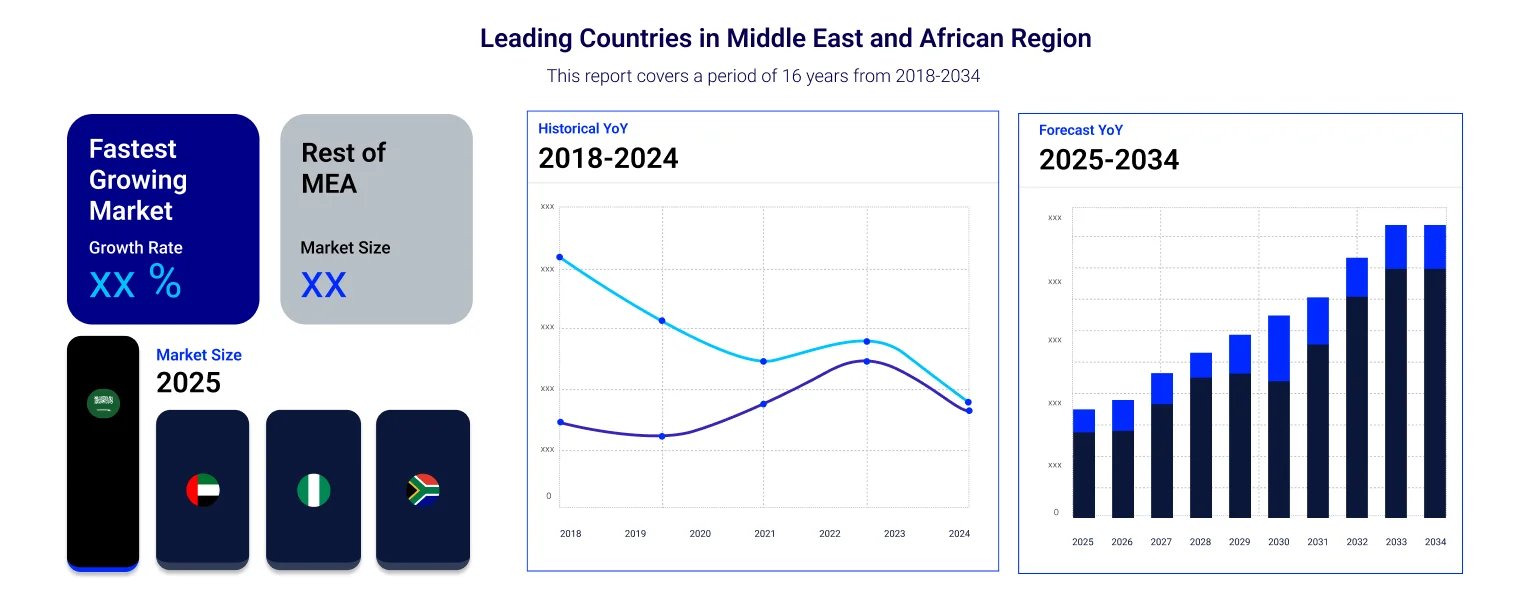
Saudi Arabia is expected to constitute a major portion of the Middle East and Africa vibration sensors market share in the forecast period. This is because of its increasing oil output and the expansion of the construction and infrastructure development sector. The increasing demand for piezoresistive technology-based vibration sensors, owing to their advanced data collection and processing capabilities, is also expected to drive the market expansion in the coming years.
Middle East and Africa Vibration Sensors Market Report and Forecast 2026-2035 offers a detailed analysis of the market based on the following segments:
Market Breakup by Product
Market Breakup by Material
Market Breakup by Technology
Market Breakup by End Use
Market Breakup by Region
The key Middle East and Africa vibration sensors market players are:


Upto 15% Off
USD
$3999 $3599
$2499 $2249
$4999 $4249
$5999 $5099


*While we strive to always give you current and accurate information, the numbers depicted on the website are indicative and may differ from the actual numbers in the main report. At Expert Market Research, we aim to bring you the latest insights and trends in the market. Using our analyses and forecasts, stakeholders can understand the market dynamics, navigate challenges, and capitalize on opportunities to make data-driven strategic decisions.*
Get in touch with us for a customized solution tailored to your unique requirements and save upto 35%!
The market is projected to grow at a CAGR of 5.60% between 2026 and 2035.
The different products in the market include accelerometers, velocity sensors, displacement sensors, and proximity probes.
The different technologies used in vibration sensors include piezoresistive, strain gauge, optical sensor, and hand probe, among others.
The major regions in the market include Saudi Arabia, the United Arab Emirates, Nigeria, and South Africa, among others.
The key market players are Yokogawa Electric Corp., SKF AB, Rockwell Automation Inc., Emerson Electric Co., Honeywell International Inc., Analog Devices, Inc., NXP Semiconductors N.V., and Hansford Sensors Ltd., among others.
Explore our key highlights of the report and gain a concise overview of key findings, trends, and actionable insights that will empower your strategic decisions.
| REPORT FEATURES | DETAILS |
| Base Year | 2025 |
| Historical Period | 2019-2025 |
| Forecast Period | 2026-2035 |
| Scope of the Report |
Historical and Forecast Trends, Industry Drivers and Constraints, Historical and Forecast Market Analysis by Segment:
|
| Breakup by Product |
|
| Breakup by Material |
|
| Breakup by Technology |
|
| Breakup by End Use |
|
| Breakup by Region |
|
| Market Dynamics |
|
| Competitive Landscape |
|
| Companies Covered |
|
Single User License
One User
USD 3,999
USD 3,599
tax inclusive*
Datasheet
One User
USD 2,499
USD 2,249
tax inclusive*
Five User License
Five User
USD 4,999
USD 4,249
tax inclusive*
Corporate License
Unlimited Users
USD 5,999
USD 5,099
tax inclusive*
*Please note that the prices mentioned below are starting prices for each bundle type. Kindly contact our team for further details.*
Flash Bundle
Small Business Bundle
Growth Bundle
Enterprise Bundle
*Please note that the prices mentioned below are starting prices for each bundle type. Kindly contact our team for further details.*
Flash Bundle
Number of Reports: 3
20%
tax inclusive*
Small Business Bundle
Number of Reports: 5
25%
tax inclusive*
Growth Bundle
Number of Reports: 8
30%
tax inclusive*
Enterprise Bundle
Number of Reports: 10
35%
tax inclusive*
How To Order

Select License Type
Choose the right license for your needs and access rights.

Click on ‘Buy Now’
Add the report to your cart with one click and proceed to register.

Select Mode of Payment
Choose a payment option for a secure checkout. You will be redirected accordingly.
Gain insights to stay ahead and seize opportunities.

Get insights & trends for a competitive edge.

Track prices with detailed trend reports.

Analyse trade data for supply chain insights.

Leverage cost reports for smart savings

Enhance supply chain with partnerships.

Connect For More Information
Our expert team of analysts will offer full support and resolve any queries regarding the report, before and after the purchase.
Our expert team of analysts will offer full support and resolve any queries regarding the report, before and after the purchase.
We employ meticulous research methods, blending advanced analytics and expert insights to deliver accurate, actionable industry intelligence, staying ahead of competitors.
Our skilled analysts offer unparalleled competitive advantage with detailed insights on current and emerging markets, ensuring your strategic edge.
We offer an in-depth yet simplified presentation of industry insights and analysis to meet your specific requirements effectively.


Share