

Consumer Insights
Uncover trends and behaviors shaping consumer choices today
Procurement Insights
Optimize your sourcing strategy with key market data
Industry Stats
Stay ahead with the latest trends and market analysis.

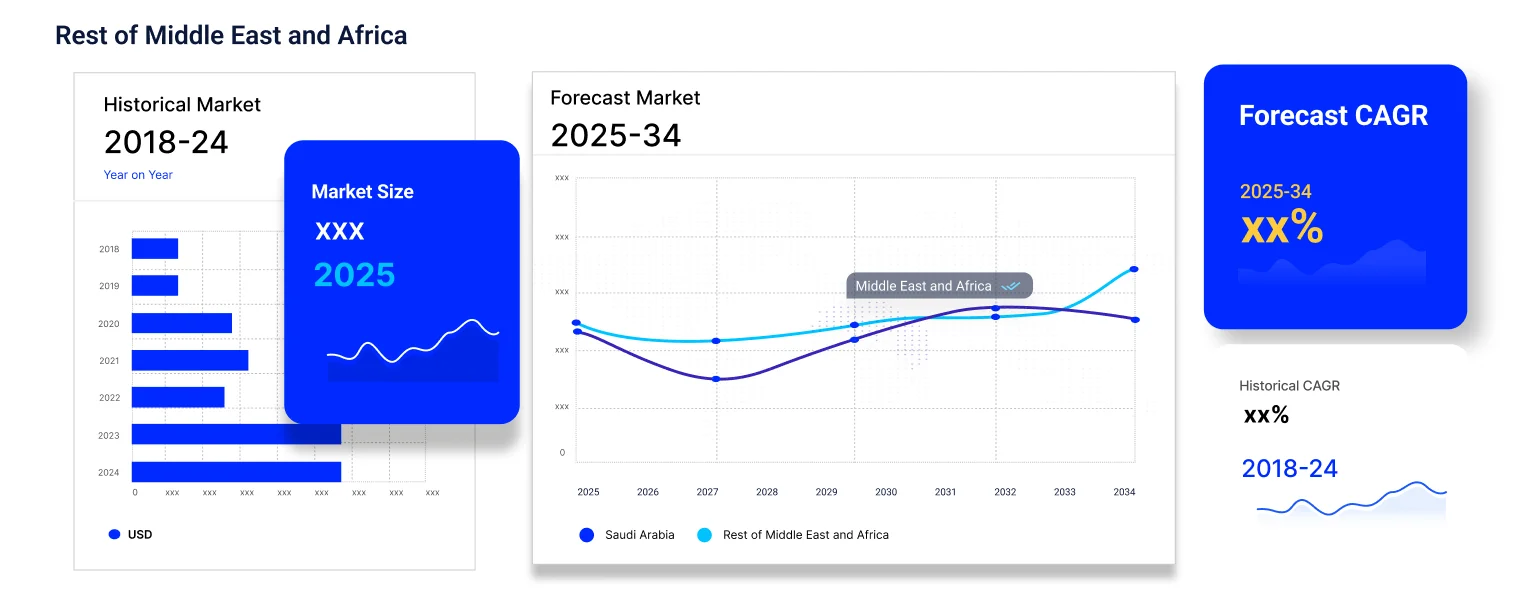
The Middle East and Africa meal replacement market size reached around USD 0.99 Billion in 2025. The market is projected to grow at a CAGR of 7.80% between 2026 and 2035 to reach nearly USD 2.10 Billion by 2035. The market growth can be attributed to the rising prevalence of obesity among consumers and the strengthening of government initiatives focusing on sugary drinks and ultra-processed foods. Moreover, as traditional ingredients like dates become a part of meal replacement solutions, the market is expected to witness sustained growth in the coming years.
Base Year
Historical Period
Forecast Period
Countries in the Middle East and Africa are witnessing a high prevalence of health issues like diabetes, obesity, and hypertension. Reportedly, nearly 85% of Saudi Arabia’s population reports diabetes as a serious problem. This is prompting key players to introduce meal replacement solutions that can address the region’s increasing demand for weight management, overall health improvement, and blood sugar control.
The robust growth of the e-commerce sector is creating lucrative Middle East and Africa meal replacement market opportunities. Reportedly, the value of e-commerce transactions in South Africa is projected to reach ZAR 225 billion by the end of 2025, attributed to shifting consumer behaviours. With the increasing transactional value of e-commerce in the country, consumers are expected to purchase meal replacement solutions from online channels due to their variety, convenience, and ability to compare product options.
With rising environmental consciousness, key players are adopting eco-friendly packaging and sourcing ingredients in an ethical and sustainable manner to gain a competitive advantage. In the forecast period, the introduction of favourable government policies aimed at minimising waste generation and promoting sustainability is anticipated to propel the market.
Compound Annual Growth Rate
7.8%
Value in USD Billion
2026-2035
*this image is indicative*
|
Middle East and Africa Meal Replacement Market Report Summary |
Description |
Value |
|
Base Year |
USD Billion |
2025 |
|
Historical Period |
USD Billion |
2019-2025 |
|
Forecast Period |
USD Billion |
2026-2035 |
|
Market Size 2025 |
USD Billion |
0.99 |
|
Market Size 2035 |
USD Billion |
2.10 |
|
CAGR 2019-2025 |
Percentage |
XX% |
|
CAGR 2026-2035 |
Percentage |
7.80% |
|
CAGR 2026-2035 - Market by Country |
Nigeria |
8.4% |
|
CAGR 2026-2035 - Market by Country |
United Arab Emirates |
8.0% |
|
CAGR 2026-2035 - Market by Purpose |
Slimming |
8.5% |
|
CAGR 2026-2035 - Market by Distribution Channel |
Online Channels |
11.7% |
|
2025 Market Share by Country |
South Africa |
12.3% |
As per the World Obesity Federation, nearly 46% of Saudis consider themselves to be overweight, with 62% of the population reportedly having a relative/ family member who is overweight. The nation has one of the highest rates of prevalence of obesity, with 48% of people being overweight. Around 24% of boys aged 15-18 years are overweight, along with 34% of adult women. These statistics paint a concerning picture of the future of healthcare outcomes among the nation’s citizens, suggesting that obesity is expected to continue in the next generation. This has prompted companies to launch innovative weight management foods and meal replacement products in response to heightened consumer demand, which is driving the Middle East and Africa meal replacement market value.
Qatar has also witnessed a substantial increase in the number of obesity cases. As per the Global Nutrition Report, 35.9% of all adult males and 46.1% of all adult females in the country are obese due to a combination of various factors like sedentary lifestyles and unhealthy dietary habits. However, increasing consumer consciousness for maintaining a healthy lifestyle has increased the Middle East and Africa meal replacement market revenue.
Rising incidences of non-communicable diseases; increasing sales of functional beverages; favourable government health initiatives; and soaring demand for nutrition bars are the major factors driving the Middle East and Africa meal replacement market growth.
Non-communicable diseases (NCDs) account for over 50% of all mortalities in African countries. In Ghana, NCDs cause 43% of all mortality cases, with cases of diabetes, stroke, and heart problems being common. This has prompted market players to take a proactive approach to consumer health and offer them nutritious products to support their overall well-being.
Rapid technological advancements have enabled beverage manufacturers to use scientifically backed ingredients for developing functional beverages which have specific physiological effects on consumers after consumption.
In Middle Eastern countries like the United Arab Emirates, the government is launching various initiatives to promote healthy eating habits among children and adults to better manage the rising incidences of obesity among its citizens and expats and control the rising number of cases of diabetes. This can favourably influence the Middle East and Africa meal replacement market dynamics in the coming years.
Health-conscious consumers are shifting towards the consumption of nutritional bars, which are increasingly being marketed as ideal meal replacement solutions for people seeking convenient and healthy food products over traditional snacks like biscuits and chocolates.
Rising preference for spicy soups in Ghana
Spicy soups are expected to dominate the demand in Ghana since they are highly nutritious, flavourful, and light meals. Domestic consumers prefer soups formulated with tomatoes, chilli peppers, fish, meat, and other ingredients that have a high health profile and hot taste. As per the Middle East and Africa meal replacement market analysis, vegetable soups which can minimise the incidence of obesity are expected to sustain the market growth in the coming years.
Increasing use of dates as a superfood
The Saudi Arabia based company, Thurath Al-Madina, aims to expand its existing range of nutritious beverage products and position dates as a versatile and trendy ingredient in many international food products. Dates are revered for their numerous health benefits in the Middle East and play a crucial role in reducing the risk of brain degenerative disorders and cardiovascular diseases. They also ease constipation, regulate blood pressure, and reduce labour pain among pregnant women. The increasing use of dates in meal replacement beverages is expected to facilitate the Middle East and Africa meal replacement market expansion in the upcoming years.
The EMR’s report titled “Middle East and Africa Meal Replacement Market Report and Forecast 2026-2035” offers a detailed analysis of the market based on the following segments:
Breakup by Product
Breakup by Purpose
Breakup by Flavour
Breakup by Distribution Channel
Breakup by Region
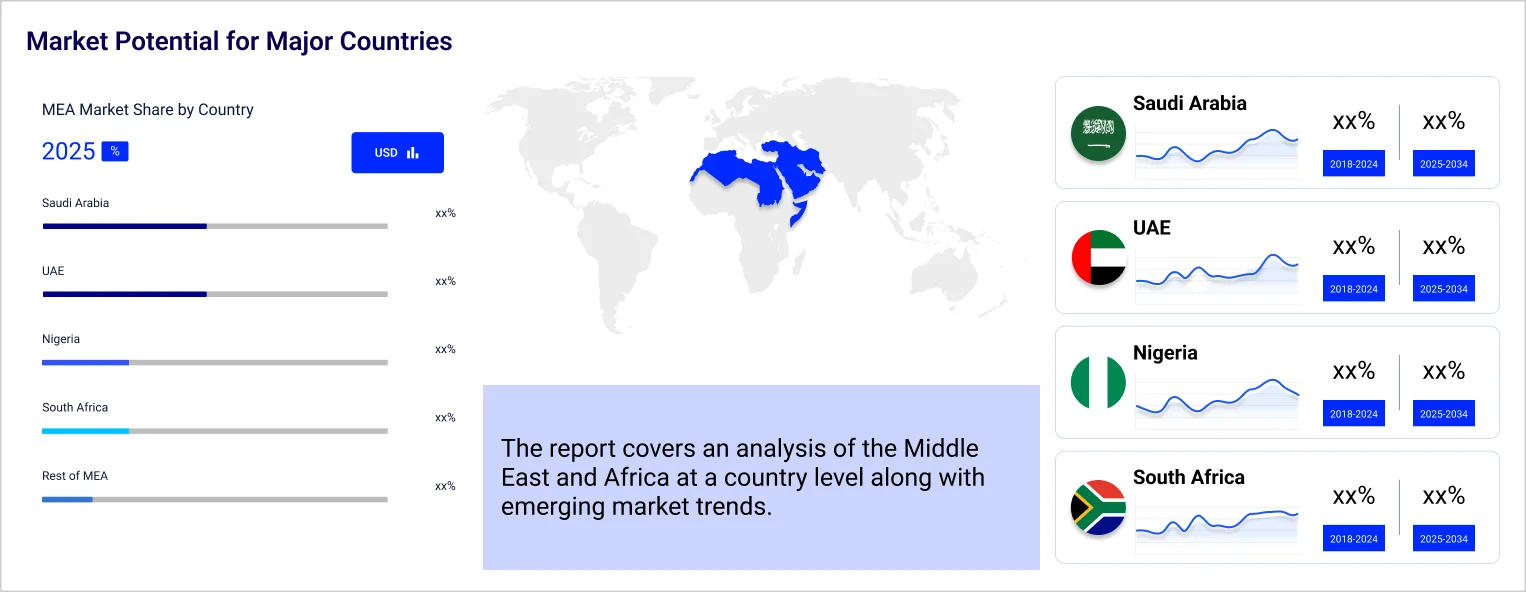
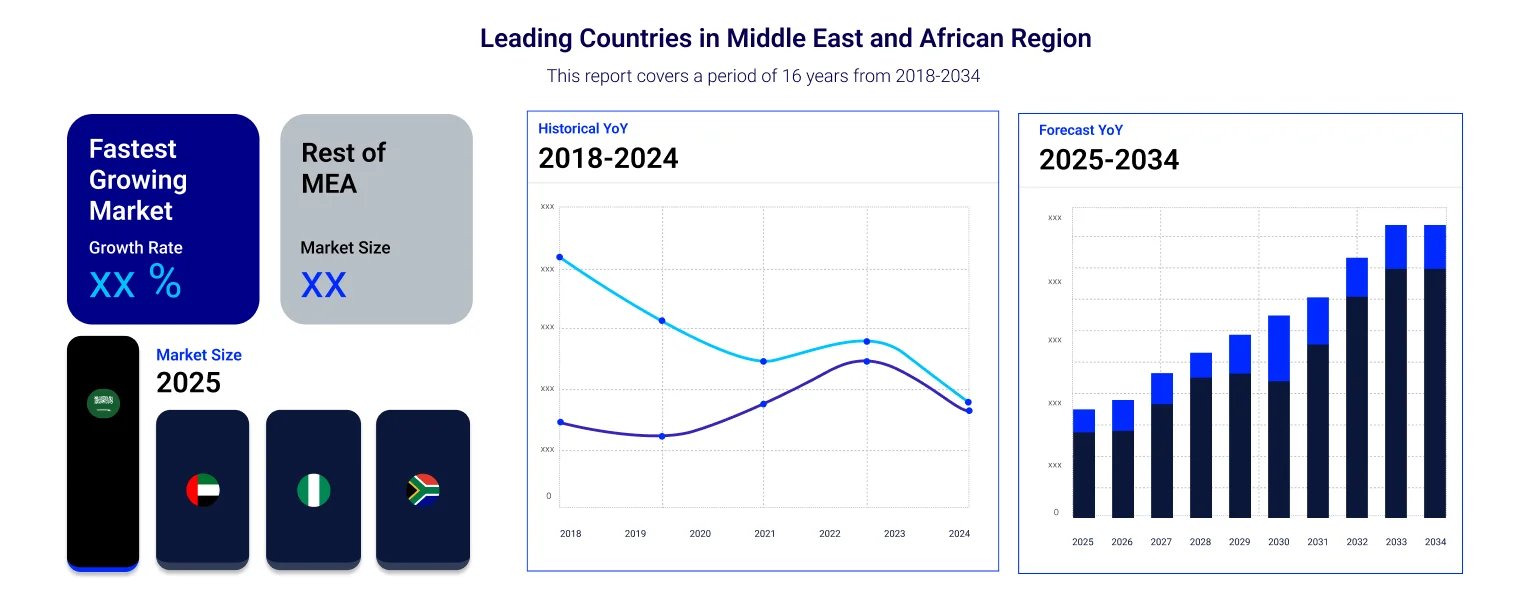
Based on country, the market is segmented into Saudi Arabia, the United Arab Emirates, Nigeria, and South Africa, among others. South Africa represented 12.3% of the overall market share in 2025. Nigeria and the UAE are expected to grow at a CAGR of 8.4% and 8.0% respectively, during the forecast period of 2026-2035 as a result of increasing demand for dates-infused superfoods and functional beverages formulated with natural ingredients.
Based on distribution channel, the market is divided into hypermarkets/supermarkets, convenience stores, speciality stores, and online channels, among others. As per the Middle East and Africa meal replacement market analysis, online distribution channels and speciality stores are expected to grow at a CAGR of 11.7% and 8.3%, respectively, between 2026 and 2035. This can be attributed to rising smartphone penetration and internet accessibility in the region, apart from the rising demand for novel meals that can be consumed quickly.
|
CAGR 2026-2035 - Market by |
Distribution Channel |
|
Online Channels |
11.7% |
|
Speciality Stores |
8.3% |
|
Hypermarkets/Supermarkets |
XX% |
|
Convenience Stores |
XX% |
|
Others |
XX% |
Major players are bolstering their capacity expansion plans to cater to the rising demand for meal replacement solutions among health-conscious consumers. Companies are also focusing on expanding their regional market presence in countries like Egypt and Jordan, which is expected to positively impact the Middle East and Africa meal replacement market dynamics.
Almarai was founded in 1977 and is headquartered in Riyadh, Saudi Arabia. It is the world’s largest vertically integrated dairy products manufacturing company whose products are sold in 220,000 stores across 7 countries. In 2023, it reported net sales of SAR 19.576 billion.
NOW Health Group, Inc. was founded in 1968 and is headquartered in Illinois, United States. It provides health and wellness products, including supplements, sports nutrition, personal care, and other items.
Iovate Health Sciences International Inc. was founded in 1995 and is headquartered in Ontario, Canada. It manufactures nutritional products with scientifically tested ingredients for active consumers and sports athletes.
Bio-Engineered Supplements and Nutrition, Inc. was founded in 2001 and is headquartered in Illinois, United States. It is a leading manufacturer of sports nutrition products and has won over 35 awards during the past 6 years for its products.
*Please note that this is only a partial list; the complete list of key players is available in the full report. Additionally, the list of key players can be customized to better suit your needs.*
Other players included in the Middle East and Africa meal replacement market report are Glanbia plc, BellRing Brands, Inc., Applied Nutrition Ltd., BPI Sports, Dexter Jackson Signature Series, LLC., and EFX Sports, among others.


Upto 15% Off
USD
$2499 $2249
$3999 $3599
$4999 $4249
$5999 $5099


*While we strive to always give you current and accurate information, the numbers depicted on the website are indicative and may differ from the actual numbers in the main report. At Expert Market Research, we aim to bring you the latest insights and trends in the market. Using our analyses and forecasts, stakeholders can understand the market dynamics, navigate challenges, and capitalize on opportunities to make data-driven strategic decisions.*
Get in touch with us for a customized solution tailored to your unique requirements and save upto 35%!
In 2025, the market reached an approximate value of USD 0.99 Billion.
The market is projected to grow at a CAGR of 7.80% between 2026 and 2035.
The market is estimated to witness healthy growth in the forecast period of 2026-2035 to reach a value of around USD 2.10 Billion by 2035.
The different countries considered in the market report include Saudi Arabia, the United Arab Emirates, Nigeria, and South Africa, among others.
The different meal replacement products available in the market are soups, and shakes, among others.
Consumers purchase meal replacement products for body building or slimming.
The different distribution channels for meal replacement products are hypermarkets/supermarkets, convenience stores, speciality stores, and online channels, among others.
Key players in the market are Almarai, NOW Health Group, Inc., Glanbia plc, BellRing Brands, Inc., Applied Nutrition Ltd., Iovate Health Sciences International Inc., BPI Sports, Dexter Jackson Signature Series, LLC., Bio-Engineered Supplements and Nutrition, Inc., and EFX Sports, among others.
Explore our key highlights of the report and gain a concise overview of key findings, trends, and actionable insights that will empower your strategic decisions.
| REPORT FEATURES | DETAILS |
| Base Year | 2025 |
| Historical Period | 2019-2025 |
| Forecast Period | 2026-2035 |
| Scope of the Report |
Historical and Forecast Trends, Industry Drivers and Constraints, Historical and Forecast Market Analysis by Segment:
|
| Breakup by Product |
|
| Breakup by Purpose |
|
| Breakup by Flavour |
|
| Breakup by Distribution Channel |
|
| Breakup by Region |
|
| Market Dynamics |
|
| Competitive Landscape |
|
| Companies Covered |
|
Datasheet
One User
USD 2,499
USD 2,249
tax inclusive*
Single User License
One User
USD 3,999
USD 3,599
tax inclusive*
Five User License
Five User
USD 4,999
USD 4,249
tax inclusive*
Corporate License
Unlimited Users
USD 5,999
USD 5,099
tax inclusive*
*Please note that the prices mentioned below are starting prices for each bundle type. Kindly contact our team for further details.*
Flash Bundle
Small Business Bundle
Growth Bundle
Enterprise Bundle
*Please note that the prices mentioned below are starting prices for each bundle type. Kindly contact our team for further details.*
Flash Bundle
Number of Reports: 3
20%
tax inclusive*
Small Business Bundle
Number of Reports: 5
25%
tax inclusive*
Growth Bundle
Number of Reports: 8
30%
tax inclusive*
Enterprise Bundle
Number of Reports: 10
35%
tax inclusive*
How To Order

Select License Type
Choose the right license for your needs and access rights.

Click on ‘Buy Now’
Add the report to your cart with one click and proceed to register.

Select Mode of Payment
Choose a payment option for a secure checkout. You will be redirected accordingly.
Gain insights to stay ahead and seize opportunities.

Get insights & trends for a competitive edge.

Track prices with detailed trend reports.

Analyse trade data for supply chain insights.

Leverage cost reports for smart savings

Enhance supply chain with partnerships.

Connect For More Information
Our expert team of analysts will offer full support and resolve any queries regarding the report, before and after the purchase.
Our expert team of analysts will offer full support and resolve any queries regarding the report, before and after the purchase.
We employ meticulous research methods, blending advanced analytics and expert insights to deliver accurate, actionable industry intelligence, staying ahead of competitors.
Our skilled analysts offer unparalleled competitive advantage with detailed insights on current and emerging markets, ensuring your strategic edge.
We offer an in-depth yet simplified presentation of industry insights and analysis to meet your specific requirements effectively.


Share