

Consumer Insights
Uncover trends and behaviors shaping consumer choices today
Procurement Insights
Optimize your sourcing strategy with key market data
Industry Stats
Stay ahead with the latest trends and market analysis.
Trending Now


The global microdisplay market reached a value of about USD 1.93 Billion in 2024. The market is further anticipated to grow at a CAGR of nearly 19.70% in the forecast period of 2025-2034 to attain a value of USD 11.65 Billion by 2034.
Base Year
Historical Year
Forecast Year
Microdisplays are increasingly used in automotive applications such as head-up displays (HUDs), augmented reality (AR) dashboards, smart mirrors, in-car entertainment, and high-quality visual displays. Reportedly, 85.4 million motor vehicles were manufactured globally in 2022. As automotive technology advances, especially with the advent of electric vehicles (EVs) and autonomous cars, the demand for microdisplays in modern infotainment systems, vehicle settings, and navigation displays is expected to rise.
Microdisplays are used in wearables to provide high-resolution and compact visuals related to real-time data like activity levels, heart rate, and notifications. Reportedly, 44% of Americans owned health monitoring devices such as smart rings or smartwatches in 2023. As consumers increasingly adopt smartwatches and smart rings, the demand for compact and high-quality microdisplays that can efficiently present health data is rising.
Advanced medical imaging systems such as CT scans, MRIs, and X-ray machines use microdisplays to provide compact, high-resolution, and efficient visual displays. Hence, the growing healthcare spending by governments globally is boosting the microdisplay market revenue. For instance, in FY 2024-25, the Indian government allocated INR 89,287 crore for the healthcare sector.


Value in USD Billion
2025-2034
Microdisplay Market Outlook
*this image is indicative*
| Global Microdisplay Market Report Summary | Description | Value |
| Base Year | USD Billion | 2024 |
| Historical Period | USD Billion | 2018-2024 |
| Forecast Period | USD Billion | 2025-2034 |
| Market Size 2024 | USD Billion | 1.93 |
| Market Size 2034 | USD Billion | 11.65 |
| CAGR 2018-2024 | Percentage | XX% |
| CAGR 2025-2034 | Percentage | 19.70% |
| CAGR 2025-2034 - Market by Region | Asia Pacific | 22.7% |
| CAGR 2025-2034 - Market by Country | India | 26.1% |
| CAGR 2025-2034 - Market by Country | UK | 18.0% |
| CAGR 2025-2034 - Market by Product | Near-to-Eye (NTE) Devices | 21.7% |
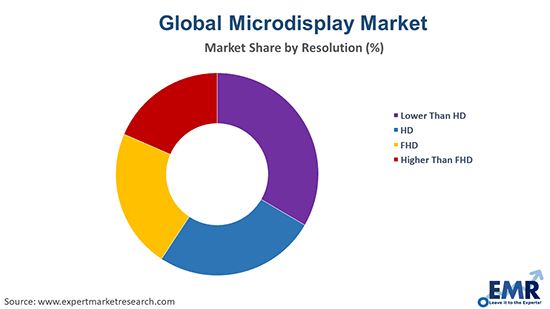
| CAGR 2025-2034 - Market by Resolution | Higher Than FHD | 22.5% |
| Market Share by Country 2024 | Canada | 2.4% |
North America is the leading region in the global microdisplay market. The growing use of ICT technology in the education industry is changing conventional classroom teaching, which, in effect, is boosting the regional market growth. High spending on the military by the United States government is contributing to increased spending on microdisplay technologies, like night vision HUDs and thermal imaging.
The Asia Pacific is projected to see the highest growth rate in the forecast period. The involvement of leading market players including Sony Corporation, LG Electronics Inc., and Toshiba Corporation is expected to fuel the market development in the Asia Pacific in the coming years.
Growing applications of AR and VR technology; development of flexible and transparent microdisplays; rising trend of miniaturisation; and increasing preference for OLED microdisplays are favouring the microdisplay market expansion.
The rising applications of AR and VR technology in diverse sectors, ranging from food and beverages to warehouse management, are driving the microdisplay market development. Microdisplays are crucial in VR and AR devices such as VR headsets, smart glasses, and AR lenses to provide immersive and high-quality visual experiences.
The development of flexible and transparent microdisplays amid the growing demand for more dynamic, versatile, and integrated display solutions is aiding the market. As flexible microdisplays can conform and bend as per surfaces, they enable designers to create customised and unique display sizes and shapes for use in foldable devices, smart textiles, and fashion accessories.
The growing trend of miniaturisation, especially in sectors such as wearables, automotive, medical devices, and consumer electronics, is surging the demand for microdisplays to maintain high-resolution screens with improved brightness, resolution, and colour accuracy. Advancements in materials and processes aimed at facilitating the miniaturisation of microdisplays are expected to further drive the market in the coming years.
There is a rising preference for OLED microdisplays as they boast lightweight and compact design, energy efficiency, high brightness and contrast, fast refresh rate, low power consumption, and wide operation temperature range, boosting their utilisation in applications in diverse end-use sectors, ranging from consumer electronics to medical devices.
Read more about this report - REQUEST FREE SAMPLE COPY IN PDF
Microdisplays are small screen having micro-level resolution as well as a horizontal panel size of less than two inches. These displays achieve lower production costs and power dissipation, produce large images from a compact and lightweight device and can also incorporate display chip drivers. OLED-on-silicon technology has been introduced by manufacturers in recent years, offering enhanced image quality through high-resolution, bi-directional, and ultra-low-power microdisplays. OLED microdisplays have also attracted enormous popularity with the growing use of technology in augmented reality (AR) and virtual reality (VR) applications.
Based on product, the market can be divided into following:
The market breakup on the basis of technology can be as follows:
The resolution of the microdisplay can be categorised as follows:
On the basis of brightness, the industry can be segmented into:
Based on end-uses, the market is divided into the following:


Based on Region, the market is divided into the following:
| CAGR 2025-2034 - Market by | Country |
| India | 26.1% |
| UK | 18.0% |
| USA | 17.6% |
| Germany | 16.2% |
| France | 15.4% |
| Canada | XX% |
| Italy | XX% |
| China | XX% |
| Japan | 13.6% |
| Australia | XX% |
| Saudi Arabia | XX% |
Microdisplay provides various features over direct-view screens, like CRTs and flat-panel LCDs. As a result, they are integrated into a wide variety of consumer products, including modern 3G wireless networking devices, digital camera systems, wireless DVD players, and wearable PCs. In addition, microdisplay is used in a variety of industries, ranging from military and defence to industrial to medical and educational. In military applications, for example, aircraft OEMs and military aviation regulators are proposing the implementation of head-up displays (HUDs) in military aircraft to avoid crash accidents. In addition, major companies are investing in research and development (R&D) in the production of next generation microdisplays with advanced technologies including optical waveguides as well as micro-electromechanical laser scanning (MEMS) systems.
Key microdisplay market players are focusing on technological advancements to develop microdisplays with improved colour accuracy, resolution, and energy efficiency. Microdisplay companies are also investing in cost-effective manufacturing techniques to enhance the availability of transparent and flexible microdisplays for use in applications such as smart clothing, wearable technology, and AR glasses.
Kopin Corporation, founded in 1984 and headquartered in Massachusetts, United States, is a leading provider of high-performance micro-displays and application-specific optical solutions for use in applications such as enterprise, defence, consumer, training and simulation, and medical. Its technology portfolio includes ultra-small Active-Matrix Liquid Crystal displays (AMLCD), Organic Light Emitting Diode (OLED) displays, Liquid Crystal on Silicon (LCOS) displays, Micro Light Emitting Diode (Micro-LED) displays, and various low-power ASICs.
Himax Technologies, Inc., founded in 2001 and headquartered in Tainan City, Taiwan, is a fabless semiconductor solution provider and a leader in display driver ICs and timing controllers. The company also designs and manufactures controllers for in-cell Touch and Display Driver Integration (TDDI) single-chip solutions, LED driver ICs, touch sensor displays, power management ICs, LED driver ICs, and LCoS micro-displays for automotive HUD and AR devices.
eMagin, Inc., headquartered in New York, United States, and founded in 1996, is a leader in OLED microdisplays and virtual imaging technologies. The company is engaged in designing, developing, manufacturing, and marketing OLED on silicon displays and virtual imaging products for the commercial, defence, industrial, and medical sectors.
Jasper Display Corp., headquartered in California, United States, and founded in 2010, is a prominent designer of SLM (Spatial Light Modulators) and high-speed Full HD (FHD, ~2 million pixels) microdisplays. It is also a pioneer in the X-on-Silicon business model and offers wafers, finished microdisplays, controllers, and die packs to its customers.
*Please note that this is only a partial list; the complete list of key players is available in the full report. Additionally, the list of key players can be customized to better suit your needs.*
Other key players in the microdisplay market include Sony Semiconductor Solutions Corporation, and Seiko Epson Corporation, among others.
*While we strive to always give you current and accurate information, the numbers depicted on the website are indicative and may differ from the actual numbers in the main report. At Expert Market Research, we aim to bring you the latest insights and trends in the market. Using our analyses and forecasts, stakeholders can understand the market dynamics, navigate challenges, and capitalize on opportunities to make data-driven strategic decisions.*
Get in touch with us for a customized solution tailored to your unique requirements and save upto 35%!
In 2024, the global microdisplay market attained a value of nearly USD 1.93 Billion.
The market is projected to grow at a CAGR of 19.70% between 2025 and 2034.
The market is estimated to witness a healthy growth in the forecast period of 2025-2034 to reach about USD 11.65 Billion by 2034.
The major drivers of the market are increased adoption of ICT technology in the educational sector, growing investments in the defence and military sector, and the rising demand for consumer electronic products such as digital camera systems, wireless DVD players and others.
The key trends guiding the growth of the market include the launch of next generation microdisplay with technologies like optical waveguides and micro-electromechanical laser scanning (MEMS) systems and increased investments by the key players in research and development activities.
The major regions in the market are North America, Latin America, the Middle East and Africa, Europe, and the Asia Pacific.
Near-to-eye (NTE) devices, head-up display (HUD), and projector, among others, are the major products in the market.
Consumer, industrial and enterprise, automotive, military, defence and aerospace, sports and entertainment, retail and hospitality, medical, and education are the significant end uses of the product.
The major players in the global microdisplay market are Kopin Corporation, Himax Technologies, Inc., eMagin, Inc., Sony Semiconductor Solutions Corporation, Jasper Display Corp., and Seiko Epson Corporation, among others.
Explore our key highlights of the report and gain a concise overview of key findings, trends, and actionable insights that will empower your strategic decisions.
| REPORT FEATURES | DETAILS |
| Base Year | 2024 |
| Historical Period | 2018-2024 |
| Forecast Period | 2025-2034 |
| Scope of the Report |
Historical and Forecast Trends, Industry Drivers and Constraints, Historical and Forecast Market Analysis by Segment:
|
| Breakup by Product |
|
| Breakup by Resolution |
|
| Breakup by Technology |
|
| Breakup by Brightness |
|
| Breakup by End Use |
|
| Breakup by Region |
|
| Market Dynamics |
|
| Competitive Landscape |
|
| Companies Covered |
|
| Report Price and Purchase Option | Explore our purchase options that are best suited to your resources and industry needs. |
| Delivery Format | Delivered as an attached PDF and Excel through email, with an option of receiving an editable PPT, according to the purchase option. |
Datasheet
One User
USD 2,499
USD 2,249
tax inclusive*
Single User License
One User
USD 3,999
USD 3,599
tax inclusive*
Five User License
Five User
USD 4,999
USD 4,249
tax inclusive*
Corporate License
Unlimited Users
USD 5,999
USD 5,099
tax inclusive*
*Please note that the prices mentioned below are starting prices for each bundle type. Kindly contact our team for further details.*
Flash Bundle
Small Business Bundle
Growth Bundle
Enterprise Bundle
*Please note that the prices mentioned below are starting prices for each bundle type. Kindly contact our team for further details.*
Flash Bundle
Number of Reports: 3
20%
tax inclusive*
Small Business Bundle
Number of Reports: 5
25%
tax inclusive*
Growth Bundle
Number of Reports: 8
30%
tax inclusive*
Enterprise Bundle
Number of Reports: 10
35%
tax inclusive*
How To Order
Our step-by-step guide will help you select, purchase, and access your reports swiftly, ensuring you get the information that drives your decisions, right when you need it.

Select License Type
Choose the right license for your needs and access rights.

Click on ‘Buy Now’
Add the report to your cart with one click and proceed to register.

Select Mode of Payment
Choose a payment option for a secure checkout. You will be redirected accordingly.
Gain insights to stay ahead and seize opportunities.

Get insights & trends for a competitive edge.

Track prices with detailed trend reports.

Analyse trade data for supply chain insights.

Leverage cost reports for smart savings

Enhance supply chain with partnerships.

Connect For More Information
Our expert team of analysts will offer full support and resolve any queries regarding the report, before and after the purchase.
Our expert team of analysts will offer full support and resolve any queries regarding the report, before and after the purchase.
We employ meticulous research methods, blending advanced analytics and expert insights to deliver accurate, actionable industry intelligence, staying ahead of competitors.
Our skilled analysts offer unparalleled competitive advantage with detailed insights on current and emerging markets, ensuring your strategic edge.
We offer an in-depth yet simplified presentation of industry insights and analysis to meet your specific requirements effectively.
Australia
63 Fiona Drive, Tamworth, NSW
+61-448-061-727
India
C130 Sector 2 Noida, Uttar Pradesh 201301
+91-723-689-1189
Philippines
40th Floor, PBCom Tower, 6795 Ayala Avenue Cor V.A Rufino St. Makati City,1226.
+63-287-899-028, +63-967-048-3306
United Kingdom
6 Gardner Place, Becketts Close, Feltham TW14 0BX, Greater London
+44-753-713-2163
United States
30 North Gould Street, Sheridan, WY 82801
+1-415-325-5166
Vietnam
193/26/4 St.no.6, Ward Binh Hung Hoa, Binh Tan District, Ho Chi Minh City
+84-865-399-124
United States (Head Office)
30 North Gould Street, Sheridan, WY 82801
+1-415-325-5166
Australia
63 Fiona Drive, Tamworth, NSW
+61-448-061-727
India
C130 Sector 2 Noida, Uttar Pradesh 201301
+91-723-689-1189
Philippines
40th Floor, PBCom Tower, 6795 Ayala Avenue Cor V.A Rufino St. Makati City, 1226.
+63-287-899-028, +63-967-048-3306
United Kingdom
6 Gardner Place, Becketts Close, Feltham TW14 0BX, Greater London
+44-753-713-2163
Vietnam
193/26/4 St.no.6, Ward Binh Hung Hoa, Binh Tan District, Ho Chi Minh City
+84-865-399-124


Share