

Consumer Insights
Uncover trends and behaviors shaping consumer choices today
Procurement Insights
Optimize your sourcing strategy with key market data
Industry Stats
Stay ahead with the latest trends and market analysis.

The global marine battery market attained a value of USD 863.25 Million in 2025. The market is estimated to grow at a CAGR of 16.20% during 2026-2035 to reach a value of USD 3874.34 Million by 2035.
Base Year
Historical Period
Forecast Period
During 2024-2028, the global maritime trade is expected to grow by more than 2%. The need to decarbonise the growing marine sector provides significant opportunities for the market.
As of 2022, coastal and marine tourism contributed about 50% of all global tourism, accounting for USD 4.6 trillion, or 5.2% of the global GDP.
China boasts the world’s largest shipbuilding industry, and as of 2023, China’s marine economy exceeded USD 1.3 trillion (9 trillion yuan).
Compound Annual Growth Rate
16.2%
Value in USD Million
2026-2035
*this image is indicative*
| Global Marine Battery Market Report Summary | Description | Value |
| Base Year | USD Million | 2025 |
| Historical Period | USD Million | 2019-2025 |
| Forecast Period | USD Million | 2026-2035 |
| Market Size 2025 | USD Million | 863.25 |
| Market Size 2035 | USD Million | 3874.34 |
| CAGR 2019-2025 | Percentage | XX% |
| CAGR 2026-2035 | Percentage | 16.20% |
| CAGR 2026-2035 - Market by Region | Asia Pacific | 20.3% |
| CAGR 2026-2035 - Market by Country | India | 24.5% |
| CAGR 2026-2035 - Market by Country | Italy | 16.9% |
| CAGR 2026-2035 - Market by Battery Type | Lithium | 25.9% |
| CAGR 2026-2035 - Market by Propulsion Type | Fully Electric | 20.3% |
| Market Share by Country | USA | 28.2% |
Read more about this report - REQUEST FREE SAMPLE COPY IN PDF
The global market for marine battery is primarily driven by the electrification of the marine sector to reduce its emissions. In July 2023, International Maritime Organisation (IMO) member states adopted the updated 2023 IMO Strategy to reduce the GHG emissions from ships and achieve net-zero GHG emissions from international shipping by or around 2050. It also includes the adoption of alternative zero and net-zero GHG fuels by 2030.
Batteries on ships can be used as part of a renewable energy solution for hybrid marine power and electrical propulsion systems. Batteries allow fully electric ships to operate in zero-emission mode, serving as the sole source of electricity. As a result, they limit GHG emissions, enabling ships to comply with strict port requirements and travel in environmentally controlled areas (ECA).
As of 2023, the marine sector’s greenhouse gas emissions, which make up 3% of the world’s total, have climbed by 20% over the last decade, aiding the marine battery market. In the absence of intervention, emissions may increase to 130% of 2008 levels by 2050. The marine fleet is rapidly ageing. Many ships are too old to be scrapped or too young to be retrofitted, with more than half of them being older than 15 years. The ageing fleet provides an opportunity for the marine sector to invest in low-emission electric and hybrid vessels.
Figure: CO2 Emissions by Country of Vessel Ownership (Million Tonnes), 2022
| Country | CO2 Emissions (Million Tonnes) |
| China | 102.32 |
| Japan | 101.25 |
| Greece | 95.97 |
| USA | 45.66 |
| China, Hong Kong | 39.06 |
| Germany | 37.04 |
| Singapore | 32.52 |
| South Korea | 28.74 |
| Denmark | 28.01 |
| Norway | 26.50 |
| Bermuda | 25.13 |
| UK | 23.72 |
| Taiwan | 22.93 |
| Switzerland | 20.81 |
| Netherlands | 15.02 |
| France | 13.50 |
| UAE | 12.96 |
| Italy | 12.22 |
| Turkey | 11.65 |
| Russia | 11.01 |
| Indonesia | 10.83 |
| India | 6.97 |
Favourable government initiatives; advancement in battery technology; and investment in strengthening the Navy are the key trends impacting the global marine battery market development
Governments globally are supporting the decarbonisation of marine-based activities, such as maritime transport by encouraging green shipping. For instance, the European Investment Bank (EIB) invested USD 242.5 million in shipping and USD 396.2 million in ocean-related research and innovation between 2019 and 2023.
As of 2023, the average age of commercial cargo vessels is over 20 years. As a result, proper maintenance and incorporation of technology necessitates the replacement of vessels, providing an opportunity for the adoption of electric and hybrid vessels. Asian countries such as Japan are constantly focusing on replacing their ageing fleet to strengthen their marine sector.
The advancement in dual-purpose marine batteries offering improved energy density and fast charging options aids their adoption. Additionally, the decreasing cost of lithium-ion phosphate batteries while offering high energy density, chemical stability, and a prolonged life cycle positively impacts the marine battery market revenue.
Governments globally are increasing their defence budgets to strengthen their security, providing an opportunity for green technologies, such as marine batteries. For instance, in 2023, the USA planned to expand the Defense Department spending to USD 842 billion in 2024, up 3.2% over FY23. Under this plan, the Navy and Marine Corps’ budget is expected to grow by more than USD 11 billion in 2024.
The global marine sector, which primarily relies on heavy fuel oil, is a major contributor to global CO2, SO2, and NOx emissions. As a ‘hard to abate’ industry, international shipping contributes to around 2-3% of global GHG emissions, as of 2022.
In July 2023, the member states of the International Maritime Organization (IMO) adopted the 2023 IMO Strategy on Reduction of GHG Emissions from ships. The revised strategy aims for net-zero GHG emissions from international shipping by around 2050. It also includes a target to promote the adoption of alternative zero and near-zero GHG fuels by 2030. The electrification of maritime vessels is a low-emission alternative to traditional fuels.
Total seaborne trade experienced a global increase from 10,247 million tons in 2016 to 10,985 million tons in 2021, with an annual growth rate of 3.2%, according to UNCTAD's World Seaborne Trade data. Developed economies saw a modest rise in loaded volumes from 4,500 million tons to 4,936 million tons, growing at an annual rate of 2.4%. Discharged volumes in developed economies increased from 4,278 million tons to 4,553 million tons, with a notable annual growth rate of 4.1%, resulting in a balance shift from -53 million tons to 658 million tons.
Developing economies showed significant growth in loaded volumes, climbing from 5,747 million tons in 2016 to 6,049 million tons in 2021, with a 3.9% annual growth rate. Discharged volumes in developing economies rose from 5,750 million tons to 6,698 million tons, with a 2.7% annual growth rate, leading to a balance change from -4 million tons to -648 million tons.
Within developing economies, Africa's loaded volumes increased from 694 million tons to 762 million tons, with an annual growth rate of 3.6%. Discharged volumes in Africa rose sharply from 480 million tons to 553 million tons, achieving an 8.5% annual growth rate, while the balance remained relatively stable, changing slightly from 214 million tons to 209 million tons.
The Americas saw a slight rise in loaded volumes from 1,355 million tons to 1,383 million tons, with a 0.7% annual growth rate. Discharged volumes increased from 566 million tons to 638 million tons, with an 8.2% annual growth rate, resulting in a balance improvement from 789 million tons to 745 million tons.
Asia and Oceania experienced significant growth in loaded volumes, rising from 3,698 million tons to 3,904 million tons, with a 5.1% annual growth rate. Discharged volumes increased from 4,704 million tons to 5,507 million tons, with a 1.5% annual growth rate, leading to a balance shift from -1,006 million tons to -1,603 million tons.
Total goods loaded worldwide increased from 3,366 million tons in 1976 to 10,985 million tons in 2021, reflecting robust growth in global trade, according to UNCTAD's development of goods loaded data. Crude oil shipments peaked at 1,832 million tons in 2016 before slightly declining to 1,700 million tons in 2021, indicating fluctuating oil trade volumes.
Dry cargo consistently grew from 1,522 million tons in 1976 to 8,033 million tons in 2021, highlighting the increasing demand for bulk and containerized goods. Other tanker trade volumes also expanded, reaching 1,252 million tons in 2021, up from 289 million tons in 1976, showcasing the diversification in liquid bulk trade beyond crude oil.
From 1976 to 1996, total goods loaded rose steadily from 3,366 million tons to 4,758 million tons, driven by increases in dry cargo from 1,522 million tons to 2,631 million tons. This period also saw crude oil volumes grow modestly from 1,555 million tons to 1,590 million tons, while other tanker trades increased from 289 million tons to 537 million tons.
Between 2001 and 2011, total goods loaded surged from 6,020 million tons to 8,739 million tons, with dry cargo experiencing significant growth from 3,844 million tons to 5,959 million tons. Crude oil volumes remained relatively stable, fluctuating around 1,678 million tons to 1,751 million tons, while other tanker trade saw a notable increase from 499 million tons to 1,028 million tons.
By 2021, total goods loaded reached 10,985 million tons, with dry cargo at 8,033 million tons, reflecting the highest growth rate among cargo types. The steady increase in other tanker trade to 1,252 million tons and the slight decline in crude oil to 1,700 million tons indicate shifting dynamics in global maritime trade, with a growing emphasis on diversified cargo types beyond crude oil.
Read more about this report - REQUEST FREE SAMPLE COPY IN PDF
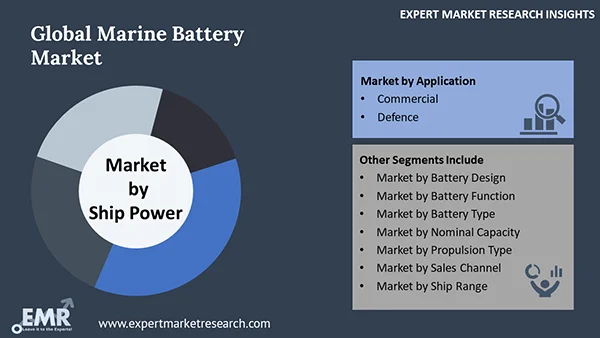
“Global Marine Battery Market Report and Forecast 2026-2035” offers a detailed analysis of the market based on the following segments:
Market Breakup by Application
Market Breakup by Battery Design
Market Breakup by Battery Function
Market Breakup by Battery Type
Market Breakup by Nominal Capacity
Market Breakup by Propulsion Type
Market Breakup by Sales Channel
Market Breakup by Ship Power
Market Breakup by Ship Range
Market Breakup by Region
| CAGR 2026-2035 - Market by | Battery Type |
| Lithium | 25.9% |
| Lead-Acid Battery | XX% |
| Fuel Cell | XX% |
| Others | XX% |
| CAGR 2026-2035 - Market by | Propulsion Type |
| Fully Electric | 20.3% |
| Hybrid | XX% |
| Plug-In Hybrid | XX% |
| CAGR 2026-2035 - Market by | Region |
| Asia Pacific | 20.3% |
| Europe | 15.4% |
| North America | XX% |
| Latin America | XX% |
| Middle East and Africa | XX% |
Based on application, the commercial segment accounts for a significant share of the market due to expanding trade
Modern battery systems can extend the range of ships, reduce emissions, and decrease maintenance demands by optimizing engine and generator operations. This has increased their use in marine trade. Plug-in hybrid propulsion systems are advantageous for inland towboats in certain trades, such as to conduct environmentally friendly barge transportation. As per marine battery industry analysis, in 2022, the Netherlands accounted for over 50% of the registered goods transport vessels used on the EU inland waterways with metal ores being the largest transported goods category.
| Market Share by | Country |
| USA | 28% |
| Canada | XX% |
| UK | XX% |
| Germany | XX% |
Based on battery type, lithium is a major contributor to the marine battery market due to improvement in their charging efficiency
Lithium batteries provide a reliable, efficient, and powerful energy storage solution for commercial marine vessels. They offer longer lifespans, faster charging times, no active maintenance requirements, and are lightweight, making them suitable for most demanding marine applications. A key advancement in dual-purpose lithium marine battery technology is the significant improvement in charging efficiency.
The market players are focusing on providing products at competitive prices and high quality, with improved customer service, product support, and performance features.
Headquartered in Japan and founded in 1875, Toshiba Corporation delivers products and services through its business domains, namely, Energy Systems & Solutions, Infrastructure Systems & Solutions, Building Solutions, Retail & Printing Solutions, Electronic Devices & Storage Solutions, Digital Solutions, and Battery Business. The company offers solutions for the marine battery industry under the SCiB™ lithium-ion battery brand.
Headquartered in Germany and founded in 1847, Siemens Energy, a subsidiary of Siemens AG is a leading entity in the global energy technology sector. The company’s comprehensive portfolio includes conventional and renewable technologies, such as gas turbines, steam turbines and power transformers. Its marine battery solution, BlueVault™ energy storage solutions is an advanced lithium-ion battery-based solution, suited for both all-electric and hybrid energy-storage applications.
Headquartered in Norway and founded in 2009, Corvus Energy specialises in the deployment of large-scale energy storage systems (ESS), employing cutting-edge lithium-ion battery technology that is reliable across a diverse array of demanding maritime and transportation applications. Corvus Energy serves as the premier supplier of battery systems for hybrid and electric commercial marine vessels, including ferries, cruise ships, offshore supply vessels, and tugboats.
Headquartered in Switzerland and founded in 1909, Leclanché stands as a globally renowned provider of top-tier energy storage solutions. The company encompasses the development of proprietary lithium cells, battery modules, racks, and packs, alongside rafting sophisticated Battery Management Systems and Energy Management Software. The company’s marine battery solution includes Navius MRS-3 Marine Rack System.
*Please note that this is only a partial list; the complete list of key players is available in the full report. Additionally, the list of key players can be customized to better suit your needs.*
Other notable players in the marine battery market report are PowerTech Systems, Saft Groupe SAS, Contemporary Amperex Technology Co. Ltd., GS Yuasa Corporation, AYK Energy Ltd., Echandia Group AB, and EVE Energy Co., Ltd., among others.


Europe is a prominent region in the market due to rising governmental initiatives to lower GHG emissions of the marine sector
The ferry industry is a significant contributor to GHG emissions. In 2021, ferries and cargo ships accounted for up to 4% of the EU's CO2 emissions. Without prompt action, transport emissions could reach 40% by 2030. Hence the ferry industry is adopting electrification to cut its emissions by 800,000 tonnes annually.
| CAGR 2026-2035 - Market by | Country |
| India | 24.5% |
| China | 21.3% |
| Italy | 16.9% |
| Germany | 16.8% |
| France | 16.6% |
| USA | XX% |
| Canada | XX% |
| UK | XX% |
| Japan | XX% |
| Australia | XX% |
| Saudi Arabia | XX% |
| Brazil | XX% |
| Mexico | XX% |
The UK is a significant naval shipbuilder and holds around 5% market share in the nascent green shipbuilding sector. Its Maritime Research & Innovation UK (MarRI-UK) initiative launched in 2019 is engaged in developing and leveraging emerging technologies. Some of its key projects include using batteries for marine applications and electrification of the domestic passenger ferries.
An ageing marine fleet and rapid decarbonisation of the marine sector in the Asia Pacific provides an opportunity for the marine battery market. As of 2022, 5,000 of Japan’s 7,000 passenger vessels are over 15 years, providing an opportunity to replace the ageing fleet with battery-operated vessels. India targets 100% of green fuel-powered vessels by 2047. Further, the ASEAN countries are focused on reducing the emissions of their marine transportation, thus increasing the marine battery market value. Singapore for instance, aims for full electric propulsion and net zero fuels for its harbour craft fleet by 2050.


Upto 15% Off
USD
$2499 $2249
$3999 $3599
$4999 $4249
$5999 $5099


*While we strive to always give you current and accurate information, the numbers depicted on the website are indicative and may differ from the actual numbers in the main report. At Expert Market Research, we aim to bring you the latest insights and trends in the market. Using our analyses and forecasts, stakeholders can understand the market dynamics, navigate challenges, and capitalize on opportunities to make data-driven strategic decisions.*
Get in touch with us for a customized solution tailored to your unique requirements and save upto 35%!
The market attained a value of USD 863.25 Million in 2025.
The marine battery market is estimated to grow at a CAGR of 16.20% during 2026-2035.
The market is estimated to witness a healthy growth in the forecast period of 2026-2035 to reach a value of USD 3874.34 Million by 2035.
The factors driving the market growth are governmental targets to reduce the emissions of the shipping sector, a rising ageing fleet of marine vessels, and rising maritime trade.
The major trends in the market growth include advancement in battery technology, reducing costs of batteries, and a growing charging infrastructure at ports.
The key regional markets marine battery are North America, Europe, Asia Pacific, and Latin America, Middle East and Africa.
The applications include commercial and defence.
The battery types include lithium, lead-acid battery, fuel cell, and others.
The key players in the market include Toshiba Corporation, Siemens Energy AG, Corvus Energy Holding, Leclanché SA, Powertech Systems, Saft Groupe SAS, Contemporary Amperex Technology Co. Ltd., GS Yuasa Corporation, AYK Energy Ltd., Echandia Group AB, and EVE Energy Co., Ltd., among others.
Limited charging infrastructure in many regions and heavy weight and size of current battery technologies are hindering the market growth.
Explore our key highlights of the report and gain a concise overview of key findings, trends, and actionable insights that will empower your strategic decisions.
| REPORT FEATURES | DETAILS |
| Base Year | 2025 |
| Historical Period | 2019-2025 |
| Forecast Period | 2026-2035 |
| Scope of the Report |
Historical and Forecast Trends, Industry Drivers and Constraints, Historical and Forecast Market Analysis by Segment:
|
| Breakup by Application |
|
| Breakup by Battery Design |
|
| Breakup by Battery Function |
|
| Breakup by Battery Type |
|
| Breakup by Nominal Capacity |
|
| Breakup by Propulsion Type |
|
| Breakup by Sales Channel |
|
| Breakup by Ship Power |
|
| Breakup by Ship Range |
|
| Breakup by Region |
|
| Market Dynamics |
|
| Competitive Landscape |
|
| Companies Covered |
|
| Report Price and Purchase Option | Explore our purchase options that are best suited to your resources and industry needs. |
| Delivery Format | Delivered as an attached PDF and Excel through email, with an option of receiving an editable PPT, according to the purchase option. |
Datasheet
One User
USD 2,499
USD 2,249
tax inclusive*
Single User License
One User
USD 3,999
USD 3,599
tax inclusive*
Five User License
Five User
USD 4,999
USD 4,249
tax inclusive*
Corporate License
Unlimited Users
USD 5,999
USD 5,099
tax inclusive*
*Please note that the prices mentioned below are starting prices for each bundle type. Kindly contact our team for further details.*
Flash Bundle
Small Business Bundle
Growth Bundle
Enterprise Bundle
*Please note that the prices mentioned below are starting prices for each bundle type. Kindly contact our team for further details.*
Flash Bundle
Number of Reports: 3
20%
tax inclusive*
Small Business Bundle
Number of Reports: 5
25%
tax inclusive*
Growth Bundle
Number of Reports: 8
30%
tax inclusive*
Enterprise Bundle
Number of Reports: 10
35%
tax inclusive*
How To Order

Select License Type
Choose the right license for your needs and access rights.

Click on ‘Buy Now’
Add the report to your cart with one click and proceed to register.

Select Mode of Payment
Choose a payment option for a secure checkout. You will be redirected accordingly.
Gain insights to stay ahead and seize opportunities.

Get insights & trends for a competitive edge.

Track prices with detailed trend reports.

Analyse trade data for supply chain insights.

Leverage cost reports for smart savings

Enhance supply chain with partnerships.

Connect For More Information
Our expert team of analysts will offer full support and resolve any queries regarding the report, before and after the purchase.
Our expert team of analysts will offer full support and resolve any queries regarding the report, before and after the purchase.
We employ meticulous research methods, blending advanced analytics and expert insights to deliver accurate, actionable industry intelligence, staying ahead of competitors.
Our skilled analysts offer unparalleled competitive advantage with detailed insights on current and emerging markets, ensuring your strategic edge.
We offer an in-depth yet simplified presentation of industry insights and analysis to meet your specific requirements effectively.


Share