

Consumer Insights
Uncover trends and behaviors shaping consumer choices today
Procurement Insights
Optimize your sourcing strategy with key market data
Industry Stats
Stay ahead with the latest trends and market analysis.
Trending Now


The global MRO market was valued at USD 747.61 Billion in 2024. It is expected to grow at a CAGR of 2.40% from 2025 to 2034, reaching approximately USD 947.71 Billion by 2034.
Base Year
Historical Period
Forecast Period
There’s a shift towards repairing parts rather than replacing them, driven by sustainability concerns. This generates demand for MRO products.
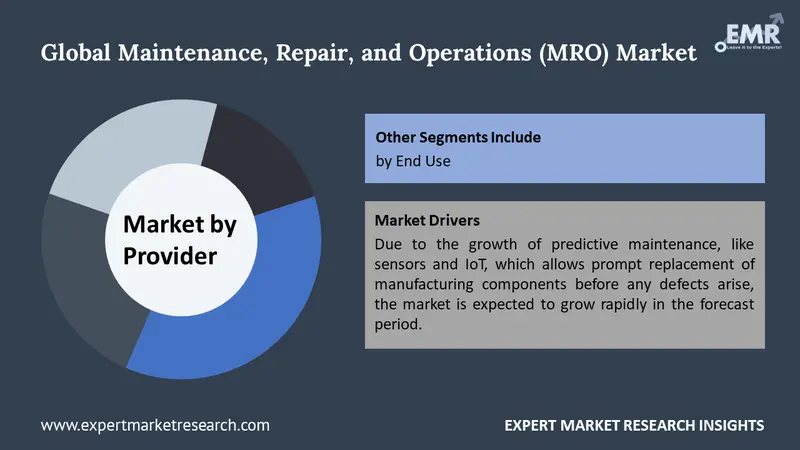
The growth of predictive maintenance, including the use of sensors and IoT, is expected to advance the MRO sector. Predictive maintenance reduces downtime and saves costs by replacing components before visible defects appear.
Industries with diverse and complex equipment like aviation, manufacturing, and energy require MRO products and services.


Value in USD Billion
2025-2034
Maintenance, Repair, and Operations (MRO) Market Outlook
*this image is indicative*
Maintenance, repair, and operations (MRO) refer to the miscellaneous expenditure by firms to ensure the smooth functioning of its operations and production process. MRO products are generally utilised during the production process, such as consumables (laboratory equipment, cleaning, or office supplies), machinery (pumps, compressors, or valves), repair and maintenance tools (lubricants, repair tools, gaskets), and other miscellaneous products like fixtures, furniture, and computers.
The rapid industrialisation and infrastructure growth in emerging markets are fuelling MRO products and services demand as economies expand and require maintaining and upgrading existing infrastructure. Additionally, companies are also prioritising asset lifecycle management, optimising asset performance and extending operational lifespan, which fosters efficiency and cost-effectiveness and drives maintenance, repair, and operations (MRO) market expansion. The shift towards predictive maintenance, enabled by sensors and IoT, is also opening avenues for MRO providers to offer advanced solutions that align with industry needs for enhanced operational efficiency and cost savings.
Shift towards predictive maintenance, focus on asset lifecycle management, and demand for advanced maintenance management systems are boosting the maintenance, repair, and operations (MRO) market development
In the aviation industry, airlines like Lufthansa Technik utilise predictive maintenance solutions that analyse data from aircraft sensors to predict component failures before they occur, enabling proactive maintenance, minimising aircraft downtime, and enhancing safety by preventing unexpected failures.
Another significant trend shaping the maintenance, repair, and operations (MRO) market outlook is the focus on asset lifecycle management. ExxonMobil implement such strategies to optimise the performance and maintenance of their critical infrastructure, from drilling equipment to refineries, which helps in extending the lifespan of assets and enhance overall operational efficiency.
In the automotive industry, companies like Tesla prioritise eco-friendly MRO practices, such as using recycled materials in vehicle repairs and implementing energy-efficient maintenance processes in their manufacturing facilities, which is driving the development of green MRO solutions.
There is a rising demand for advanced maintenance management systems and companies like Siemens utilise advanced software that integrates IoT sensors and predictive analytics to monitor equipment health in real-time and schedule maintenance proactively.


The market is also being driven by the thriving digitalisation and the rising demand for increased efficiency in businesses. The digital revolution in MRO is being driven by the adoption of technologies such as the Internet of Things (IoT), blockchain, artificial intelligence (AI), robotics, AR/VR, digital twins, and 3D printing. These technologies are increasing the efficiency of MRO operations and reducing downtime, which is thereby influencing the maintenance, repair, and operations (MRO) market growth.
Moreover, digitalisation is creating a continuous stream of data flowing through the MRO supply chain, enabling better visibility, and predictive maintenance. Digital MRO solutions like Lufthansa Technik's AVIATAR platform are providing global access, faster troubleshooting, improved time management, and reduced costs. Mobile apps are also transforming the MRO sector by improving cycle time and revenue.
Read more about this report - REQUEST FREE SAMPLE COPY IN PDF
The EMR’s report titled “Maintenance, Repair, and Operations (MRO) Market Report and Forecast 2025-2034” offers a detailed analysis of the market based on the following segments:
Market Breakup by MRO Type
Market Breakup by Provider
Market Breakup by Region
OEMs leads the market as they have better expertise and offer high-quality and genuine parts
OEMs in the MRO market are known for their specialised knowledge and expertise in their products, offering high-quality maintenance services using genuine parts for optimal performance. They lead in technological advancements and innovation, ensuring reliable maintenance solutions.
On the other hand, the aftermarket segment provides alternative maintenance services outside of OEM offerings, catering to a wide range of industries with cost-effective solutions. While OEMs focus on quality assurance, aftermarket providers offer flexibility and price competitive options for maintenance and repair services.
Market players are focused on improving service quality, leveraging technological advancements like IoT to optimise asset performance, outsourcing maintenance services, and asset lifecycle management
Air Liquide S.A. (Airgas, Inc.) was founded in 1982 and is headquartered in Pennsylvania, United States. It is a leading supplier of industrial, medical, and speciality gases, welding equipment and supplies, safety products, atmospheric gases, carbon dioxide, dry ice, nitrous oxide, ammonia, and process chemicals.
Ferguson Enterprises, LLC was founded in 1953 and is headquartered in Virginia, United States. It is a prominent distributor of plumbing supplies, PVF, waterworks, fire and fabrication products, HVAC equipment, and industrial products and services.
Rubix Group International Limited was founded in 1920. The company is headquartered in London, United Kingdom. The company supplies industrial maintenance and repairing products, including bearings, power transmission components, tools, overhaul, and other equipment.
Hayley Group Limited was founded in 1976 and is headquartered in Nevada, United States. The company supplies industrial maintenance and repairing products, including engineering components, consumables, and related support services.
*Please note that this is only a partial list; the complete list of key players is available in the full report. Additionally, the list of key players can be customized to better suit your needs.*
Other key players in the global maintenance, repair, and operations (MRO) market include Genuine Parts Company, Applied Industrial Technologies Inc., W.W. Grainger, Inc., ERIKS N.V, RS Group plc, and Adolf Würth GmbH & Co. KG, among others.
The Asia Pacific to witness a significant growth owing to the rising adoption of professional services
Asia Pacific dominates the market as the region is a manufacturing hub for spare parts, which are often supplied to other countries, owing to their cost-effectiveness. The introduction of advanced manufacturing techniques in the Asia Pacific, because of rising investments in R&D activities, is predicted to enhance the maintenance, repair, and operations (MRO) market growth further. Moreover, due to the COVID-19 pandemic, many companies that had investments in China are now shifting to other Asian countries, such as India and Taiwan, for their operations. This is expected to influence the market growth positively in the coming years.
Meanwhile, North American region with its presence of many manufacturing facilities and the increasing focus on industry development is expected to capture a growing maintenance, repair, and operations (MRO) market share. The region is also home to many major players in the market, including companies like W.W. Grainger, GE, and Rolls-Royce. The regions’ growth is further driven by the need for efficient maintenance practices and the adoption of advanced technologies like predictive maintenance and IoT.
Artificial intelligence market
Latin America Explosives Market
Maintenance, Repair, and Operations (MRO) Market Size
Maintenance, Repair, and Operations (MRO) Market Share
Maintenance, Repair, and Operations (MRO) Market Growth
Maintenance, Repair, and Operations (MRO) Market Trends
Maintenance, Repair, and Operations (MRO) Market Regional Analysis
*While we strive to always give you current and accurate information, the numbers depicted on the website are indicative and may differ from the actual numbers in the main report. At Expert Market Research, we aim to bring you the latest insights and trends in the market. Using our analyses and forecasts, stakeholders can understand the market dynamics, navigate challenges, and capitalize on opportunities to make data-driven strategic decisions.*
Get in touch with us for a customized solution tailored to your unique requirements and save upto 35%!
In 2024, the market attained a value of nearly USD 747.61 Billion.
The market is assessed to grow at a CAGR of 2.40% between 2025 and 2034.
The market is estimated to witness a healthy growth in the forecast period of 2025-2034 to reach about USD 947.71 Billion by 2034.
Key drivers of the MRO market include the need to reduce disruptions, anticipate and rectify issues, improve inventory management, enhance safety, and increase productivity. MRO is crucial for cost management, productivity, safety, and overall business.
Key trends aiding market expansion include the adoption of professional services, rising standardisation of equipment and services within critical manufacturing operations and launch of smart industries, which use predictive maintenance, like sensors and IoT.
Regions considered in the market are North America, Europe, the Asia Pacific, Latin America, and the Middle East and Africa.
The leading providers in the market are OEM and aftermarket.
The major end-use segments in the market are manufacturing, construction, electrical, facility, mining, aerospace and defence, automotive, food and beverages, pharmaceuticals, chemicals, and oil and gas, among others.
Key players in the market are Air Liquide S.A. (Airgas, Inc.), Ferguson Enterprises, LLC., Rubix Group International Limited, Hayley Group Limited, Genuine Parts Company, Applied Industrial Technologies Inc., W.W. Grainger, Inc., ERIKS N.V, RS Group plc, and Adolf Würth GmbH & Co. KG, among others.
Explore our key highlights of the report and gain a concise overview of key findings, trends, and actionable insights that will empower your strategic decisions.
| REPORT FEATURES | DETAILS |
| Base Year | 2024 |
| Historical Period | 2018-2024 |
| Forecast Period | 2025-2034 |
| Scope of the Report |
Historical and Forecast Trends, Industry Drivers and Constraints, Historical and Forecast Market Analysis by Segment:
|
| Breakup by MRO Type |
|
| Breakup by Provider |
|
| Breakup by Region |
|
| Market Dynamics |
|
| Competitive Landscape |
|
| Companies Covered |
|
Datasheet
One User
USD 2,999
USD 2,699
tax inclusive*
Single User License
One User
USD 4,399
USD 3,959
tax inclusive*
Five User License
Five User
USD 5,599
USD 4,759
tax inclusive*
Corporate License
Unlimited Users
USD 6,659
USD 5,660
tax inclusive*
*Please note that the prices mentioned below are starting prices for each bundle type. Kindly contact our team for further details.*
Flash Bundle
Small Business Bundle
Growth Bundle
Enterprise Bundle
*Please note that the prices mentioned below are starting prices for each bundle type. Kindly contact our team for further details.*
Flash Bundle
Number of Reports: 3
20%
tax inclusive*
Small Business Bundle
Number of Reports: 5
25%
tax inclusive*
Growth Bundle
Number of Reports: 8
30%
tax inclusive*
Enterprise Bundle
Number of Reports: 10
35%
tax inclusive*
How To Order
Our step-by-step guide will help you select, purchase, and access your reports swiftly, ensuring you get the information that drives your decisions, right when you need it.

Select License Type
Choose the right license for your needs and access rights.

Click on ‘Buy Now’
Add the report to your cart with one click and proceed to register.

Select Mode of Payment
Choose a payment option for a secure checkout. You will be redirected accordingly.
Track prices with detailed trend reports.

Analyse trade data for supply chain insights.

Leverage cost reports for smart savings

Enhance supply chain with partnerships.

Gain insights to stay ahead and seize opportunities.

Get insights & trends for a competitive edge.

Track prices with detailed trend reports.
Analyse trade data for supply chain insights.
Leverage cost reports for smart savings
Enhance supply chain with partnerships.
Gain insights to stay ahead and seize opportunities.
Get insights & trends for a competitive edge.
Track prices with detailed trend reports.
Analyse trade data for supply chain insights.
Connect For More Information
Our expert team of analysts will offer full support and resolve any queries regarding the report, before and after the purchase.
Our expert team of analysts will offer full support and resolve any queries regarding the report, before and after the purchase.
We employ meticulous research methods, blending advanced analytics and expert insights to deliver accurate, actionable industry intelligence, staying ahead of competitors.
Our skilled analysts offer unparalleled competitive advantage with detailed insights on current and emerging markets, ensuring your strategic edge.
We offer an in-depth yet simplified presentation of industry insights and analysis to meet your specific requirements effectively.
Australia
63 Fiona Drive, Tamworth, NSW
+61-448-061-727
India
C130 Sector 2 Noida, Uttar Pradesh 201301
+91-723-689-1189
Philippines
40th Floor, PBCom Tower, 6795 Ayala Avenue Cor V.A Rufino St. Makati City,1226.
+63-287-899-028, +63-967-048-3306
United Kingdom
6 Gardner Place, Becketts Close, Feltham TW14 0BX, Greater London
+44-753-713-2163
United States
30 North Gould Street, Sheridan, WY 82801
+1-415-325-5166
Vietnam
193/26/4 St.no.6, Ward Binh Hung Hoa, Binh Tan District, Ho Chi Minh City
+84-865-399-124
United States (Head Office)
30 North Gould Street, Sheridan, WY 82801
+1-415-325-5166
Australia
63 Fiona Drive, Tamworth, NSW
+61-448-061-727
India
C130 Sector 2 Noida, Uttar Pradesh 201301
+91-723-689-1189
Philippines
40th Floor, PBCom Tower, 6795 Ayala Avenue Cor V.A Rufino St. Makati City, 1226.
+63-287-899-028, +63-967-048-3306
United Kingdom
6 Gardner Place, Becketts Close, Feltham TW14 0BX, Greater London
+44-753-713-2163
Vietnam
193/26/4 St.no.6, Ward Binh Hung Hoa, Binh Tan District, Ho Chi Minh City
+84-865-399-124


Share