

Consumer Insights
Uncover trends and behaviors shaping consumer choices today
Procurement Insights
Optimize your sourcing strategy with key market data
Industry Stats
Stay ahead with the latest trends and market analysis.

The global LPG (Liquefied Petroleum Gas) market attained a volume of 346.09 MMT in 2025. The rapid shift towards clean cooking fuels in rural Asia and sub-Saharan Africa is boosting LPG penetration, with governments offering targeted subsidies and infrastructure support to replace traditional biomass use. As a result, the market is expected to grow at a CAGR of 1.40% during the forecast period of 2026-2035 to reach a volume of 397.71 MMT by 2035.
The market is witnessing dynamic changes as countries ramp up efforts toward cleaner fuel adoption, decentralised energy access, and rural penetration. LPG, with its lower emissions and wide utility span, has become a strategic fuel in energy transition agendas. The Indian government’s Pradhan Mantri Ujjwala Yojana (PMUY) alone added over 1.6 crore new LPG connections since inception in May 2016, showing how government policies can accelerate household-level fuel switching.
Innovations in storage, mini-cylinders, and refill tracking technology are redefining supply chains, boosting the LPG market development. For instance, in Kenya, PayGo Energy’s smart LPG metering system lets users pay per gram via mobile money, disrupting traditional refill models. Meanwhile, the European Union has invested in LPG as a bridging fuel for rural heating under the REPowerEU plan launched in May 2022, which aims to slash dependency on Russian pipeline gas.
Digital cylinder tracking, AI-based distribution routing, and smart leak detection have surfaced as top investment areas for operators aiming to curb losses and increase last-mile visibility, boosting the LPG market growth. These operational innovations, coupled with government-led pricing reforms and incentives, are drawing in both oil majors and clean-tech startups.
Base Year
Historical Period
Forecast Period
Compound Annual Growth Rate
1.4%
Value in MMT
2026-2035
*this image is indicative*
| Global LPG Market Report Summary | Description | Value |
| Base Year | MMT | 2025 |
| Historical Period | MMT | 2019-2025 |
| Forecast Period | MMT | 2026-2035 |
| Market Size 2025 | MMT | 346.09 |
| Market Size 2035 | MMT | 397.71 |
| CAGR 2019-2025 | MMT | XX% |
| CAGR 2026-2035 | MMT | 1.40% |
| CAGR 2026-2035 - Market by Region | Asia Pacific | 1.8% |
| CAGR 2026-2035 - Market by Country | India | 2.1% |
| CAGR 2026-2035 - Market by Country | Canada | 1.7% |
| CAGR 2026-2035 - Market by Application | Residential | 1.6% |
| CAGR 2026-2035 - Market by Sales Channel | Retail | 1.5% |
| Market Share by Country 2025 | India | 4.1% |
Suppliers are adopting decentralised distribution models to reach peri-urban and off-grid populations, shaping the LPG market dynamics. In Tanzania and Ghana, blockchain-based logistics management systems are being piloted to enable community-level LPG refills and tracking. This reduces logistical cost while improving stock monitoring. These systems integrate with IoT-enabled valves to detect usage and schedule deliveries automatically. Companies like Bboxx and KopaGas are proving how decentralised technology can scale clean fuel access while reducing theft and fraud in distribution.
BioLPG, a renewable variant derived from waste-based feedstock, is gaining traction in the global LPG industry as governments seek low-carbon LPG alternatives. Neste and SHV Energy offer co-processing facilities in the Netherlands to produce BioLPG at commercial scale. When bioLPG is used in place of solid and liquid fuels like coal and heating oil, it offers environmental benefits. For instance, almost 40 million households live in rural locations outside of the gas system in Europe. Currently, millions of people depend on outdated central heating systems and heating oil. Five million tonnes of CO2 emissions might be avoided if one million of them converted to bioLPG, which is the same as removing 2.5 million cars from the road. Hence, this not only lowers the carbon footprint but also positions LPG suppliers to secure green certifications, opening up B2B sales opportunities in ESG-sensitive sectors.
Instead of the traditional 12kg and 14.2kg LPG cylinders, companies are introducing 2kg and 5kg variants to target low-income and nomadic users, boosting further demand in the LPG market. For example, IndianOil recently launched a small (2 Kg) cooking gas cylinder also known as ‘Munna’, 2 Kg FTL (Free trade LPG) cylinder and ‘Chotu’ (5kg cylinder). PayGo Energy, on the other hand, uses small smart meters and digital locking valves that are remotely controlled. In India, Repos Energy has prototyped door-to-door delivery systems with refill-on-wheels mobile apps in March 2022. These low-volume cylinders help eliminate high upfront costs and are transforming LPG adoption in rural regions and urban slums.
LPG distributors are using IoT sensors to track cylinder usage in real time, transforming the LPG market trends and dynamics. AI-based algorithms now help predict refill needs down to the household level, especially in dense urban areas where refill timeliness affects retention. In Colombia, Vanti Gas’s introduction of AI-powered Predictive Quality platform in March 2023, has reduced delivery times to a significant extent. Predictive analytics also helps in proactive leak detection, reducing safety incidents. These features are helping firms reduce operational losses while offering value-added B2B services.
Rising industrial electricity tariffs and carbon penalties are pushing sectors like textile and food processing toward LPG-based heat systems. In Vietnam, the government offers tax reliefs to factories switching to LPG for boiler systems. On the other hand, Lisa Engineering Pvt Ltd, based in Greater Noida, India, has set an excellent example by opting for a cleaner source of energy by converting the traditionally used FO to LPG. This has been the result of the major push from Supreme Court of India and the National Green Tribunal, mandating the prohibition of pet coke and furnace oil as an industrial fuel. For commercial kitchens and laundromats, pre-fabricated LPG microgrids are becoming a cost-effective and scalable solution.
Read more about this report - REQUEST FREE SAMPLE
The EMR’s report titled “Global LPG Market Report and Forecast 2026-2035” offers a detailed analysis of the market based on the following segments:
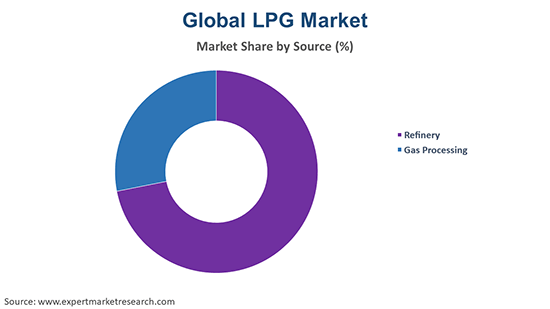
Market Breakup by Source
Key Insight: The market report, by source, covers refinery-derived, associated gas, and non-associated gas categories. Associated gas leads the market due to its integration with crude oil production, while non-associated gas is witnessing fast growth due to dedicated investments in gas fields and modular extraction technology. Refinery LPG continues to supply urban networks but lacks scalability. While associated gas remains cost-attractive, non-associated sources are preferred for long-term sustainability and emissions compliance.
Market Breakup by Application
Key Insight: As per the LPG market report, the residential category remains the top application due to household-level cooking and heating demand, supported by subsidies and mobile-based delivery models. Petrochemical usage is surging, driven by feedstock diversification in polymer production. Industrial boilers, commercial kitchens, transport vehicles, and off-grid commercial spaces also indicate growing demand.
Market Breakup by Sales Channel
Key Insight: Retail dominates the global LPG industry owing to widespread household and SME usage, while institutional channels are gaining traction due to structured procurement in public infrastructure. Retail thrives on digital accessibility and brand loyalty, while institutions offer volume stability and service-level agreements. Both sales channels are being transformed by smart refill systems and clean energy mandates.
Market Breakup by Region
Key Insight: The LPG market in the Asia Pacific region represents the dominant share owing to massive consumption, policy backing, and expanding rural networks, while Middle East and Africa are fast expanding with infrastructure rollouts, clean fuel campaigns, and smart refill initiatives. North America focuses on shale-based production and retail upgrades, whereas Europe aligns LPG use with decarbonisation and emissions compliance. Latin America balances industrial and residential needs through hybrid distribution models and mobile delivery innovations.
| CAGR 2026-2035 - Market by | Country |
| India | 2.1% |
| China | 1.7% |
| Canada | 1.7% |
| USA | 1.5% |
| Australia | 1.2% |
| Japan | 1.1% |
| UK | XX% |
| Germany | XX% |
| France | XX% |
| Italy | XX% |
| Saudi Arabia | XX% |
| Brazil | XX% |
| Mexico | XX% |
By Source, Associated Gas Accounts for the Dominant Share of the Market
Associated gas remains the largest source of the global industry due to its high yield during crude oil extraction. With increased upstream investments in countries like the United States and Nigeria, LPG output from associated gas has spiked. Recent infrastructure upgrades in the Permian Basin have improved recovery rates, while Nigeria’s NLNG project has scaled up LPG extraction as part of its gas flaring reduction roadmap.
LPG derived from non-associated gas accelerates the overall growth in the LPG market revenue due to increasing investments in standalone gas fields and shale formations. Qatar’s North Field expansion and Australia’s Browse Basin projects are ramping up LPG outputs via dedicated gas processing units. Unlike refinery-based or associated gas routes, non-associated gas offers greater supply predictability, attracting countries with limited crude oil reserves. Moreover, this source category is viewed as cleaner and operationally safer, aligning with corporate sustainability frameworks. In emerging markets like Mozambique, LNG terminals are now being configured to extract LPG at source.
By Application, the Residential Category Secures a Major Share of the Market
Residential LPG consumption holds the dominant share, boosting the global market, especially through Asia and Africa. Governments like India and Indonesia are heavily subsidising residential LPG to reduce biomass reliance. Programs like PMUY in India and Indonesia’s '3kg conversion subsidy' have spurred rapid household penetration. Companies are now bundling digital payment solutions and cylinder tracking technology to enhance rural service. For example, in India, Bharat Petroleum Corporation Limited (BPCL) introduced UPI 123PAY in May 2022, to enable voice-based payments and cylinder bookings for non-smartphone users, benefiting rural consumers. In Kenya and Uganda, startups are launching mobile apps to order LPG refills directly, bypassing middlemen. The growth is also fuelled by rising urban migration and demand for clean indoor cooking fuels. Infrastructure advancements such as community refilling centres are amplifying residential LPG availability.
The petrochemical industry is emerging as the fastest-growing application strengthening the LPG demand forecast, especially for producing ethylene and propylene. With the demand for plastics and synthetic materials rising, LPG’s role as a steam cracker feedstock is expanding. China’s Zhejiang Petrochemical and Saudi Aramco-SABIC joint ventures are using LPG to feed large-scale ethane crackers. LPG’s competitive pricing and ease of handling make it ideal for chemical firms diversifying feedstock sources amid natural gas volatility.
By Sales Channel, Retail Registers the Majority of the Market Revenue
Retail channels largely contribute to the global market value due to high residential and SME demand. LPG retailers are increasingly digitising with mobile booking, e-KYC, and refill-tracking systems. Indian Oil’s Indane and Brazil’s Ultragaz have revamped their retail tech stack to offer real-time customer support. In rural markets, retail micro-distributors equipped with mini trucks and PayGo solutions are improving last-mile connectivity. Prepaid refill cards and community refill kiosks are becoming common, especially in East Africa. Retail dominance is also supported by strong brand trust, doorstep delivery, and bundling of hardware like regulators and valves.
Increasing institutional LPG demand is stemming from schools, hospitals, and government facilities that are adopting LPG for cooking, water heating, and sterilisation. As part of clean energy transition mandates, institutions in Kenya, Bangladesh, and the Philippines are replacing diesel-based systems with LPG units. Vendors like TotalEnergies are offering bulk delivery contracts with safety training and scheduled maintenance packages. The institutional channel benefits from long-term contracts, predictable volumes, and policy-driven adoption. It is rapidly expanding in Southeast Asia and sub-Saharan Africa, where health and education sectors are receiving donor-driven infrastructure upgrades.


By Region, Asia Pacific Holds the Leading Position in the Global Market
Asia Pacific dominates the global market due to sheer volume consumption in countries like China, India, and Indonesia. Large-scale residential subsidies, petrochemical expansions, and industrial conversions are fuelling demand. China’s green development policies and India’s subsidy-led models ensure sustained consumption. Additionally, localised storage hubs and coastal terminals have improved logistical efficiency. Southeast Asia is also showing rising demand with players like Petronas, Pertamina, and PTT launching community-based micro-distribution pilots. Urbanisation, rising incomes, and LPG-centric rural policies make this region a dominant growth zone.
The Middle East and Africa LPG industry is growing rapidly due to increasing investments in domestic bottling infrastructure and export-oriented terminals. Nigeria’s National Gas Expansion Program and Egypt’s decarbonisation strategy are directing funds into LPG penetration. Morocco and Kenya have implemented clean cooking transitions with donor support. UAE and Saudi Arabia are also scaling up petrochemical LPG usage, while South Africa is investing in township-level LPG depots. These efforts are reducing kerosene reliance and boosting B2B LPG adoption across industrial clusters.
The LPG market players are increasingly offering bundled solutions like safety devices, leak detectors, and AI-based delivery platforms to boost their competitive edge. They have directed all their efforts to secure institutional contracts, expand rural footprint, and integrate with carbon offset programmes. Partnerships with IoT startups, data-driven refill forecasting, and flexible leasing models for cylinders are reshaping vendor strategies.
LPG companies are eyeing underserved zones in Africa and Southeast Asia where the demand is supported by donor-backed infrastructure. Product diversification, especially in mini-cylinders and BioLPG blends, offers fresh monetisation opportunities. IoT-based tracking, BioLPG blending, decentralised logistics, industrial conversions, and small-format cylinders are reshaping LPG markets with innovation-led scalability.
BP plc, founded in 1909 and headquartered in London, United Kingdom, is actively investing in BioLPG through its joint ventures with Green Biofuels. The company is focusing on modular LPG plants and rural refilling pilots across India and Africa.
ExxonMobil Corporation, established in 1882 and headquartered in Texas, United States, is leveraging its global refining assets to ramp up LPG exports. The firm integrates AI-based analytics for marine LPG shipments and predictive safety controls.
Chevron Corporation, founded in 1879 and based in Texas, United States, is targeting petrochemical LPG expansion via its joint venture with Phillips 66. The firm is also investing in carbon-neutral LPG supply chains.
Phillips 66 Company, founded in 1927 and headquartered in Texas, United States, is scaling its LPG retail business with smart tracking tools and pre-paid refill solutions in Latin America. The firm’s focus is on customer-centric delivery innovations.
*Please note that this is only a partial list; the complete list of key players is available in the full report. Additionally, the list of key players can be customized to better suit your needs.*
Other key players in the market are China Petroleum & Chemical Corporation (Sinopec), Total Energies SE, Bharat Petroleum Corporation Limited, Novatek, PJSC Rosneft Oil Company, Reliance Industries Limited, Saudi Arabian Oil Company, and Petróleo Brasileiro S.A., among others.
Explore the latest trends shaping the global LPG market 2026-2035 with our in-depth report. Gain strategic insights, future forecasts, and key market developments that can help you stay competitive. Download a free sample report or contact our team for customized consultation on LPG market trends 2026.
Africa CNG and LPG Vehicle Market
Australia Liquefied Petroleum Gas Market


Upto 15% Off
USD
$4399 $3959
$2999 $2699
$5599 $4759
$6659 $5660


*While we strive to always give you current and accurate information, the numbers depicted on the website are indicative and may differ from the actual numbers in the main report. At Expert Market Research, we aim to bring you the latest insights and trends in the market. Using our analyses and forecasts, stakeholders can understand the market dynamics, navigate challenges, and capitalize on opportunities to make data-driven strategic decisions.*
Get in touch with us for a customized solution tailored to your unique requirements and save upto 35%!
In 2025, the LPG market reached an approximate volume of 346.09 MMT.
The market is projected to grow at a CAGR of 1.40% between 2026 and 2035.
The market is predicted to reach 397.71 MMT by 2035.
Key strategies driving the market include Investing in modular refilling stations, piloting smart meters, collaborating with NGOs, launching AI delivery models, and developing low-cost packaging formats.
The key trends guiding the market growth include the increasing use of LPG in cooking applications, the rising demand for clean and energy efficient sources in several end-use sectors, and the rising applications of LPG in petrochemical and automotive applications.
The major regional markets of LPG are North America, Europe, Asia Pacific, Latin America, and the Middle East and Africa.
The leading sources of LPG in the market are refinery, associated gas, and non-associated gas.
The significant applications of LPG include residential, petrochemical, industrial, transport, and commercial, among others.
The major distribution channels in the market are institutional and retail.
The key players in the above market include BP plc, ExxonMobil Corporation, Chevron Corporation, Philips 66 Company, China Petroleum & Chemical Corporation (Sinopec), Total Energies SE, Bharat Petroleum Corporation Limited, Novatek, PJSC Rosneft Oil Company, Reliance Industries Limited, Saudi Arabian Oil Company, and Petróleo Brasileiro S.A., among others.
The key challenges are volatile pricing, complex cross-border logistics, safety liabilities, and lack of rural distribution infrastructure.
Explore our key highlights of the report and gain a concise overview of key findings, trends, and actionable insights that will empower your strategic decisions.
| REPORT FEATURES | DETAILS |
| Base Year | 2025 |
| Historical Period | 2019-2025 |
| Forecast Period | 2026-2035 |
| Scope of the Report |
Historical and Forecast Trends, Industry Drivers and Constraints, Historical and Forecast Market Analysis by Segment:
|
| Breakup by Source |
|
| Breakup by Application |
|
| Breakup by Sales Channel |
|
| Breakup by Region |
|
| Market Dynamics |
|
| Competitive Landscape |
|
| Companies Covered |
|
Single User License
One User
USD 4,399
USD 3,959
tax inclusive*
Datasheet
One User
USD 2,999
USD 2,699
tax inclusive*
Five User License
Five User
USD 5,599
USD 4,759
tax inclusive*
Corporate License
Unlimited Users
USD 6,659
USD 5,660
tax inclusive*
*Please note that the prices mentioned below are starting prices for each bundle type. Kindly contact our team for further details.*
Flash Bundle
Small Business Bundle
Growth Bundle
Enterprise Bundle
*Please note that the prices mentioned below are starting prices for each bundle type. Kindly contact our team for further details.*
Flash Bundle
Number of Reports: 3
20%
tax inclusive*
Small Business Bundle
Number of Reports: 5
25%
tax inclusive*
Growth Bundle
Number of Reports: 8
30%
tax inclusive*
Enterprise Bundle
Number of Reports: 10
35%
tax inclusive*
How To Order

Select License Type
Choose the right license for your needs and access rights.

Click on ‘Buy Now’
Add the report to your cart with one click and proceed to register.

Select Mode of Payment
Choose a payment option for a secure checkout. You will be redirected accordingly.
Gain insights to stay ahead and seize opportunities.

Get insights & trends for a competitive edge.

Track prices with detailed trend reports.

Analyse trade data for supply chain insights.

Leverage cost reports for smart savings

Enhance supply chain with partnerships.

Connect For More Information
Our expert team of analysts will offer full support and resolve any queries regarding the report, before and after the purchase.
Our expert team of analysts will offer full support and resolve any queries regarding the report, before and after the purchase.
We employ meticulous research methods, blending advanced analytics and expert insights to deliver accurate, actionable industry intelligence, staying ahead of competitors.
Our skilled analysts offer unparalleled competitive advantage with detailed insights on current and emerging markets, ensuring your strategic edge.
We offer an in-depth yet simplified presentation of industry insights and analysis to meet your specific requirements effectively.


Share