

Consumer Insights
Uncover trends and behaviors shaping consumer choices today
Procurement Insights
Optimize your sourcing strategy with key market data
Industry Stats
Stay ahead with the latest trends and market analysis.

The low foam surfactants market attained a value of USD 19.84 Billion as of 2025 and is anticipated to grow at a CAGR of 5.70% during the forecast period of 2026 to 2035. Growing demand for environmentally friendly, biodegradable surfactants, fueled by intense environmental regulations and consumer attitudes, is driving market growth as industries migrate toward sustainable, low-foam systems. The market is thus expected to reach a value of nearly USD 34.54 Billion by 2035.
Base Year
Historical Period
Forecast Period
Rising environmental issues and regulations are fueling the use of biodegradable, plant-based low foam surfactants. Businesses are making investments in eco-friendly solutions to minimize carbon footprints while delivering high performance in industrial and consumer applications.
Low foam surfactants are increasingly being used in automated cleaning systems such as CIP and industrial dishwashers. Their capacity to reduce foam formation improves cleaning efficiency, saves water and energy, and aids in sustainability initiatives in manufacturing and food processing sectors, thereby increasing the growth of the low foam surfactants market.
Surfactant chemistry innovations are creating multifunctional products with enhanced wetting, dispersing, and emulsifying capabilities. New nonionic and amphoteric surfactants are under development for agrochemicals, personal care, and industries to achieve controlled foam levels and excellent performance.
Compound Annual Growth Rate
5.7%
Value in USD Billion
2026-2035
*this image is indicative*
Low foam surfactants market is growing robustly with rising demand for eco-friendly solutions and growing uses in industrial cleaning.
One of the key drivers is the increasing demand for biodegradable and eco-friendly surfactants. Due to strict environmental laws and heightened consumer consciousness, industries are making a transition to bio-based substitutes to minimize their carbon footprint, thus boosting the growth of low foam surfactants market. Firms have seized the opportunity by launching innovative bio-based surfactants. For example, Clariant has introduced its Vita range, which is a 100% bio-based surfactant portfolio, cutting fossil carbon consumption and CO₂ emissions by as much as 85%. Such developments contribute to sustainability targets while improving competitiveness in the market.
Read more about this report - REQUEST FREE SAMPLE COPY IN PDF
Another major driver is the increasing demand in industrial and institutional cleaning. Demand for low foam surfactants in mechanical cleaning systems like CIP and industrial dishwashing has increased exponentially because of the effectiveness of their ability to suppress foam formation, conserve water, and save energy. Evonik and BASF have each broadened nonionic surfactant offerings in response to meeting these demands by providing superior cleanliness performance in high-speed equipment, thus boosting the low foam surfactants demand.
These drivers have enabled firms to grow their market footprint, innovate new solutions, and fortify collaborations with industries seeking high-performance but sustainable surfactants, leading to sustainable business growth.
The market is growing due to eco-friendly demand, advanced formulations, industrial cleaning, and agrochemical adoption, thus shaping the low foam surfactants market dynamics and trends.
The market is experiencing a boom in bio-based low foam surfactants from renewable feedstocks. Environmental regulations and consumer demand for eco-friendly products are promoting the use of biodegradable and non-toxic alternatives with less environmental footprint while ensuring performance in industrial and domestic cleaning applications, thus pushing the growth of the low foam surfactants market.
Low foam surfactants are being more and more employed in industrial and institutional cleaning applications for greater efficiency in automated systems. They have the capability of delivering efficient soil removal with minimal foam, and thus they find application in high-speed equipment for food processing, healthcare, and manufacturing industries with optimized performance while minimizing water and energy usage.
Surfactant chemistry innovations are resulting in multifunctional materials having better wetting, dispersing, and emulsifying abilities. Next-generation nonionic and amphoteric surfactants are being designed with controlled foam properties, increased solubility, and compatibility with a wide range of applications including agrochemicals, personal care, and industrial degreasing, thereby helping to create new trends in the low foam surfactants market.
Low foam surfactants are being used more and more in pesticide and herbicide products to improve spray coverage and penetration. Their capacity to enhance the effectiveness of active ingredients while reducing foam-related operational problems in agricultural spraying equipment is propelling demand, providing improved crop protection and increased agricultural productivity.
Low foam surfactants market is undergoing rapid growth on account of escalating demand for environment-friendly and high-performance cleaning chemicals. Growing ecological concerns have boosted the trend of bio-based surfactants, which are used as raw material from renewable feedstocks, curbing ecological footprints. Applications in home care, industrial and institutional cleaning, and agrochemicals industries are using low foam surfactants to provide better efficiency to automated and high-speed processes, thus shaping new trends in the low foam surfactants market. Formulation technological innovations are also improving their wetting, dispersing, and emulsifying capabilities to meet different applications. For instance, rhamnolipid biosurfactants have brought biodegradable, high-performing replacements for industrial cleaning applications. Other nonionic surfactants with controllable foam levels are being added to dishwasher detergents in order to increase rinse efficiency without wasting water.
Read more about this report - REQUEST FREE SAMPLE COPY IN PDF
The EMR’s report titled “Low Foam Surfactants Market Report and Forecast 2026-2035” offers a detailed analysis of the market based on the following segments:
Market Breakup by Type
Market Breakup by Application
Market Breakup by Region


Non-ionic, cationic, and amphoteric low foam surfactants are increasingly becoming popular in the global market because of their wide-ranging applications and better performance. As per low foam surfactants market analysis, non-ionic surfactants are of special demand for industrial cleaning agents and cosmetic products because they exhibit superior wetting and emulsification abilities with stability over a wide pH range. Their biodegradable nature and low toxicity increase their acceptability in environmentally friendly products. Cationic surfactants are experiencing expansion in fabric softeners, disinfectants, and antimicrobial uses because they can decrease static and offer conditioning properties. Increased hygiene and sanitation concerns have driven their use in healthcare and home cleaning products. According to low foam surfactants industry analysis, amphoteric surfactants, being mild and versatile, are increasingly being used in personal care, agriculture, and oilfield applications. Their suitability for use in both alkaline and acidic conditions ensures that they are suitable for multifunctional products, adding to their growing applications in industries worldwide.
Key low foam surfactants market players are concentrating on sustainability through the creation of bio-based and eco-friendly products to minimize dependence on fossil carbon. There is a high focus on enhancing product performance, with advancements in nonionic surfactant blends that provide better wetting, rinsing, and degreasing capabilities for industrial and institutional use. To address growing demand, low foam surfactants companies are increasing production capacities and purchasing specialized companies to enhance market share. Biotechnology advances are also taking a prominent role, making it possible to produce high-performance, environmentally friendly surfactants with greater efficiency for use in a wide array of industries.
Clariant International Ltd, founded in 1995, having its headquarters in Muttenz, Switzerland, manufactures high-performance low foam surfactants for industrial use.
Evonik Industries AG, founded in 2007, with its headquarters in Essen, Germany, manufactures a wide portfolio of low foam surfactants with excellent performance for various industrial applications.
Croda International PLC, founded in 1925, with its head office in Snaith, UK, deals in high-performance low foam surfactants that are designed to fulfill the particular requirements of industries with efficient cleaning and wetting capacity.
Stepan Company, founded in 1932, headquartered in Northfield, Illinois, USA, produces specialty chemicals, such as low foam surfactants, to achieve maximum performance in industrial processing and cleaning operations.
*Please note that this is only a partial list; the complete list of key players is available in the full report. Additionally, the list of key players can be customized to better suit your needs.*
Other key players in the low foam surfactants market report include Huntsman International LLC, and KAO Corporation, among others.


Upto 15% Off
USD
$2499 $2249
$3999 $3599
$4999 $4249
$5999 $5099


*While we strive to always give you current and accurate information, the numbers depicted on the website are indicative and may differ from the actual numbers in the main report. At Expert Market Research, we aim to bring you the latest insights and trends in the market. Using our analyses and forecasts, stakeholders can understand the market dynamics, navigate challenges, and capitalize on opportunities to make data-driven strategic decisions.*
Get in touch with us for a customized solution tailored to your unique requirements and save upto 35%!
In 2025, the low foam surfactants market reached an approximate value of USD 19.84 Billion.
The market is assessed to grow at a CAGR of 5.70% between 2026 and 2035.
The market is estimated to witness healthy growth in the forecast period of 2026-2035 to reach a value of around USD 34.54 Billion by 2035.
The major drivers of the market include rising population, growing industrialisation, the wide use of the product in the home and personal care sector.
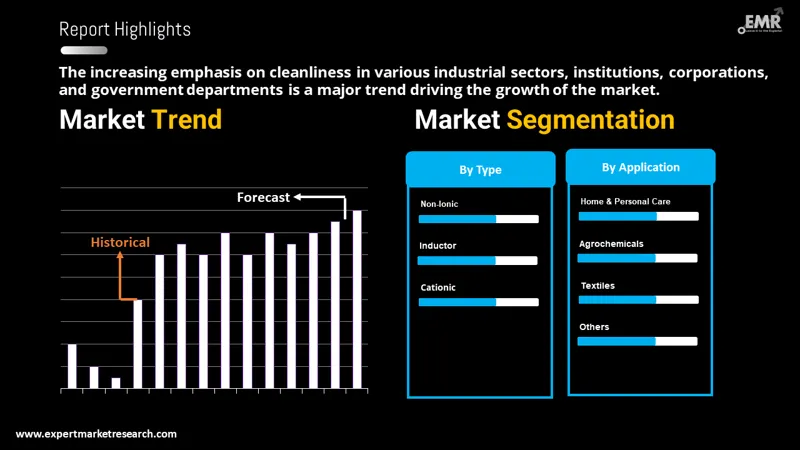
Growing awareness for cleanliness across various industrial sectors, institutes, corporate and government departments are the key trends propelling the growth of the market.
The major regions in the market are North America, Latin America, the Middle East and Africa, Europe, and the Asia Pacific.
Non-ionic, amphoteric, and cationic are major types of low foam surfactants in the market.
The application sectors include home and personal care, agrochemicals, oil field chemicals, and textiles, among others.
The major players in the market include Clariant International Ltd, Evonik Industries AG, Croda International PLC, Stepan Company, Huntsman International LLC, and KAO Corporation, among others.
Explore our key highlights of the report and gain a concise overview of key findings, trends, and actionable insights that will empower your strategic decisions.
| REPORT FEATURES | DETAILS |
| Base Year | 2025 |
| Historical Period | 2019-2025 |
| Forecast Period | 2026-2035 |
| Scope of the Report |
Historical and Forecast Trends, Industry Drivers and Constraints, Historical and Forecast Market Analysis by Segment
|
| Breakup by Type |
|
| Breakup by Application |
|
| Breakup by Region |
|
| Market Dynamics |
|
| Competitive Landscape |
|
| Companies Covered |
|
| Report Price and Purchase Option | Explore our purchase options that are best suited to your resources and industry needs. |
| Delivery Format | Delivered as an attached PDF and Excel through email, with an option of receiving an editable PPT, according to the purchase option. |
Datasheet
One User
USD 2,499
USD 2,249
tax inclusive*
Single User License
One User
USD 3,999
USD 3,599
tax inclusive*
Five User License
Five User
USD 4,999
USD 4,249
tax inclusive*
Corporate License
Unlimited Users
USD 5,999
USD 5,099
tax inclusive*
*Please note that the prices mentioned below are starting prices for each bundle type. Kindly contact our team for further details.*
Flash Bundle
Small Business Bundle
Growth Bundle
Enterprise Bundle
*Please note that the prices mentioned below are starting prices for each bundle type. Kindly contact our team for further details.*
Flash Bundle
Number of Reports: 3
20%
tax inclusive*
Small Business Bundle
Number of Reports: 5
25%
tax inclusive*
Growth Bundle
Number of Reports: 8
30%
tax inclusive*
Enterprise Bundle
Number of Reports: 10
35%
tax inclusive*
How To Order

Select License Type
Choose the right license for your needs and access rights.

Click on ‘Buy Now’
Add the report to your cart with one click and proceed to register.

Select Mode of Payment
Choose a payment option for a secure checkout. You will be redirected accordingly.
Gain insights to stay ahead and seize opportunities.

Get insights & trends for a competitive edge.

Track prices with detailed trend reports.

Analyse trade data for supply chain insights.

Leverage cost reports for smart savings

Enhance supply chain with partnerships.

Connect For More Information
Our expert team of analysts will offer full support and resolve any queries regarding the report, before and after the purchase.
Our expert team of analysts will offer full support and resolve any queries regarding the report, before and after the purchase.
We employ meticulous research methods, blending advanced analytics and expert insights to deliver accurate, actionable industry intelligence, staying ahead of competitors.
Our skilled analysts offer unparalleled competitive advantage with detailed insights on current and emerging markets, ensuring your strategic edge.
We offer an in-depth yet simplified presentation of industry insights and analysis to meet your specific requirements effectively.


Share