

Consumer Insights
Uncover trends and behaviors shaping consumer choices today
Procurement Insights
Optimize your sourcing strategy with key market data
Industry Stats
Stay ahead with the latest trends and market analysis.
Trending Now


The Latin America used car market size reached around USD 70.63 Billion in 2024. The market is projected to grow at a CAGR of 5.10% between 2025 and 2034 to reach nearly USD 116.15 Billion by 2034.
Base Year
Historical Period
Forecast Period


Value in USD Billion
2025-2034
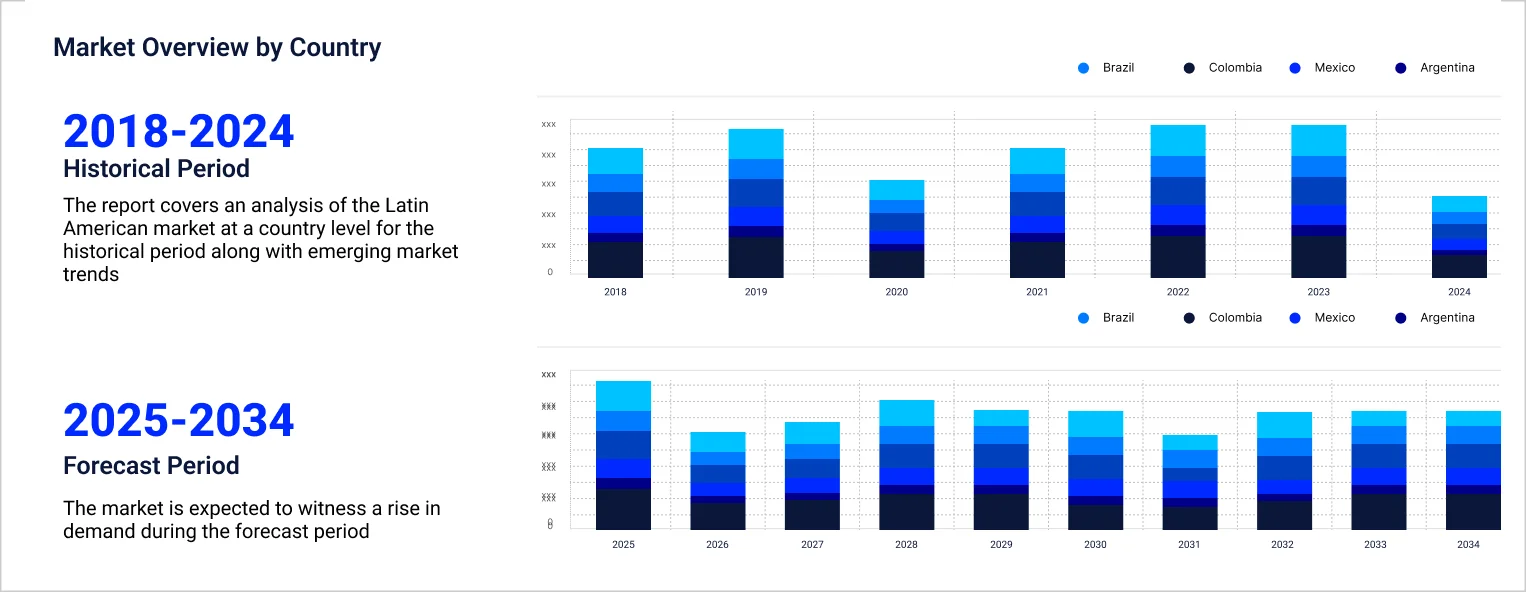
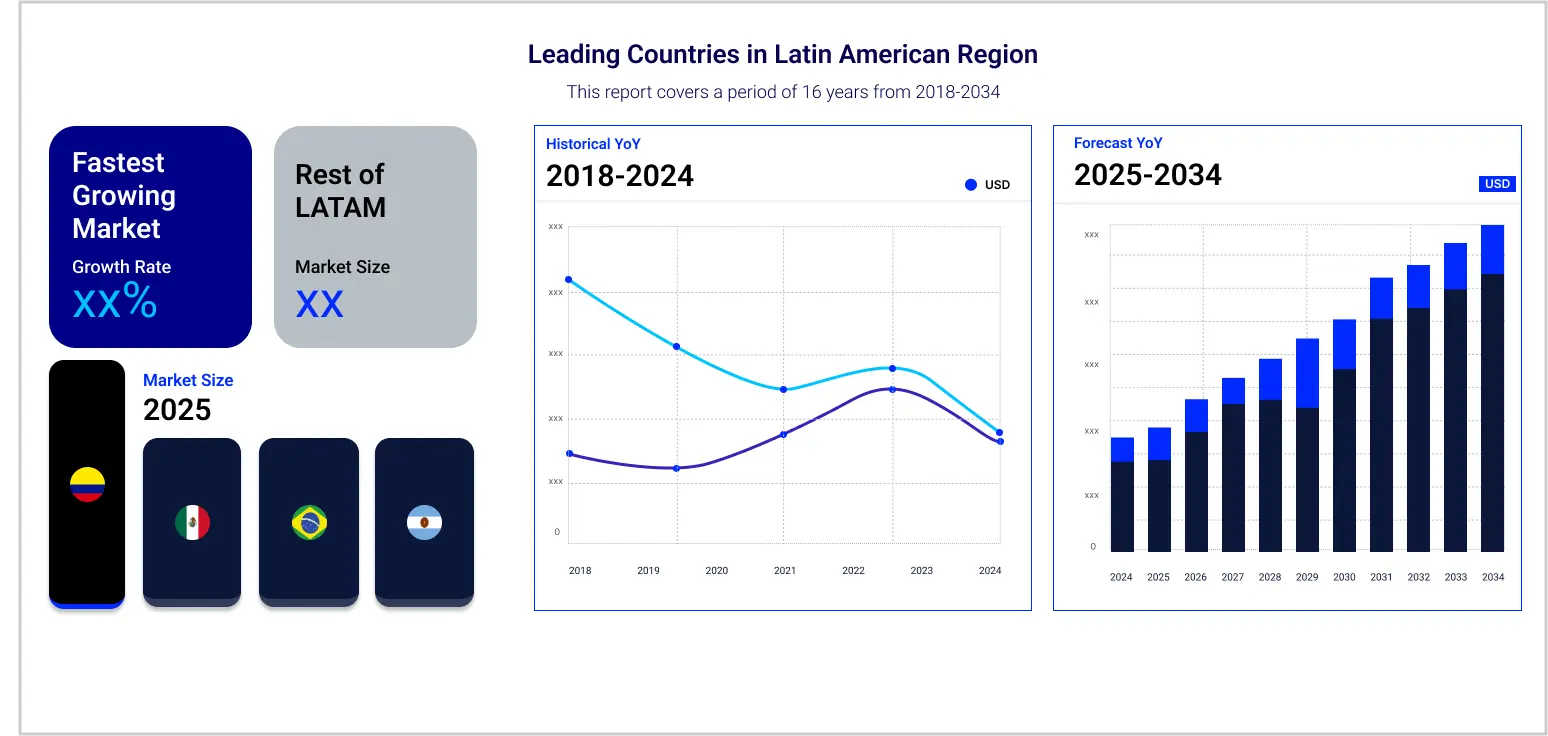
Latin America Used Car Market Outlook
*this image is indicative*
| Latin America Used Car Market Report Summary | Description | Value |
| Base Year | USD Billion | 2024 |
| Historical Period | USD Billion | 2018-2024 |
| Forecast Period | USD Billion | 2025-2034 |
| Market Size 2024 | USD Billion | 70.63 |
| Market Size 2034 | USD Billion | 116.15 |
| CAGR 2018-2024 | Percentage | XX% |
| CAGR 2025-2034 | Percentage | 5.10% |
| CAGR 2025-2034 - Market by Country | Mexico | 5.8% |
| CAGR 2025-2034 - Market by Country | Brazil | 5.5% |
| CAGR 2025-2034 - Market by Vehicle Type | Sports Utility Vehicle (SUV) | 5.6% |
| CAGR 2025-2034 - Market by Sales Channel | Online | 7.1% |
| 2024 Market Share by Country | Mexico | 17.2% |
Only 1.5 of 10 people own a car in Latin America. Unorganised vendors account for 90% of overall second-hand automotive sales in the region. This creates prohibitive barriers for people to access financing solutions, since institutions prefer lending for purchases made through professional dealerships. As per the market analysis, no formal player occupy over 1% of the Latin America used car market share. This has prompted many startups, such as Kavak, to expand their market presence by enhancing people’s access to financing used cars and reducing the risk of fraudulent transactions. The company finances around 50% of overall used car sales on its platforms, which is much higher than the industrial average of 10%. This is creating a favourable market outlook for the forecast period.
Moreover, the Andean region (including countries such as Chile, Peru, Ecuador, Argentina, and Venezuela) accounts for over 3 million used car transaction worth over USD 24 million annually. Colombia is regarded as one of the major markets for second-hand automotives in Latin America after Mexico, accounting for 1.2 million used car deals annually. As per industry reports, Mexico accounts for 6 million used car transactions in Latin America but only 5% of deals receive adequate financing. This is expected to prompt market players to make increasing investments into expanding the accessibility to financing options, which is expected to contribute to the Latin America used car market expansion.
Rising automotive imports; improvements in fuel-efficiency standards; and thriving start-up ecosystem in Mexico are factors favouring the Latin America used car market growth.
Over 4000 used car transactions in Latin America recently reported some irregularity. This is prompting market players to strengthen their safety standards to ensure a hassle-free vehicle purchase experience.
The Latin American countries are expected to strengthen the vehicle safety and emission standards for second-hand automotives imported from North America and Europe, which is expected to positively shape the Latin America used car market outlook.
By 2030, the Mexican government aims to minimise national carbon emissions by 265 million tons by reforming the fuel-efficiency standards for automotive producers. This is expected to favourably impact the Latin America used car market dynamics.
Rapid economic development has fuelled the emergence of innovative start-ups focusing on second-hand automotives in Latin America, thereby leading to market growth.

Nearly 90% of automotives present in most regions of Latin America are imported from North American and European countries. Of this, almost 80% fail to meet the minimum environmental protection and safety standards laid out by global agencies. Presence of an inadequate public transportation infrastructure has prompted people to shift towards used cars, but private motorisation levels remain at around 3%. While the global transportation industry accounts for 24% of global carbon emissions, Latin America’s transportation industry accounts for 35% of total carbon emissions. This is expected to prompt governments to introduce stringent norms for imported second-hand vehicles, thereby favouring the market growth.
The EMR’s report titled “Latin America Used Car Market Report and Forecast 2025-2034” offers a detailed analysis of the market based on the following segments:
Market Breakup by Vehicle Type:
Market Breakup by Fuel Type:
Market Breakup by Vendor Type:
Market Breakup by Application:
Market Breakup by Country:
| AGR 2025-2034 - Market by | Country |
| Mexico | 5.8% |
| Brazil | 5.5% |
| Argentina | XX% |
| Others | XX% |
Based on country, the market is segmented into Brazil, Mexico, and Argentina, among others. Mexico is projected to dominate the market, representing 17.2% of the overall market share. Over the forecast period, the demand for used cars in Mexico is expected to grow at a CAGR of 5.8% due to the growing demand for high-quality second-hand automotives in foreign markets. The market is also expected to be influenced by the introduction of stringent vehicular safety standards.
Major players are enhancing their digital market presence and focusing on improving customer purchase experience to increase the Latin America used car market value.
Latamautos Mexico was founded in 2014 and is headquartered in Mexico City. It operates in 6 countries across South America and is engaged in providing financing, insurance, vehicle tracking, and mechanical warranties for automotives, among other services.
Dalton Corporativo was founded in 2022 and is headquartered in the United States. As per Latin America used car market analysis, it is an automotive and parts dealership company based in National City of California.
Zapata Corporation was founded in 2008 and is headquartered in France. It is engaged in pioneering innovative mobility solutions (including flying scooters) and specialises in the development of personal aviation solutions.
Toyota Motor Corporation was founded in August 1937 and is headquartered in Toyota City, Japan. It is engaged in manufacturing and distribution motor vehicles worldwide.
*Please note that this is only a partial list; the complete list of key players is available in the full report. Additionally, the list of key players can be customized to better suit your needs.*
Other players included in the Latin America used car market report are S. de RL de CV, AUTOCOM SEMINUEVOS, SAPI DE CV, Grupo Seminuevos Coapa, S.A. de C.V., Car One SA, CHECK MOVILIDAD SA (KAVAK), CarAgencia S.A, Chileautos SpA, AUTOSUSADOS CHILE, and AUTOMAX SAS, among others.
*While we strive to always give you current and accurate information, the numbers depicted on the website are indicative and may differ from the actual numbers in the main report. At Expert Market Research, we aim to bring you the latest insights and trends in the market. Using our analyses and forecasts, stakeholders can understand the market dynamics, navigate challenges, and capitalize on opportunities to make data-driven strategic decisions.*
Get in touch with us for a customized solution tailored to your unique requirements and save upto 35%!
In 2024, the market reached an approximate value of USD 70.63 Billion.
The market is projected to grow at a CAGR of 5.10% between 2025 and 2034.
The different countries considered in the Latin America used car market report include Brazil, Argentina, and Mexico, among others.
The different types of vehicles in the market are hatchbacks, sedans, and SUVs, among others.
The different vehicles based on fuel type include diesel, petrol, and electric, among others.
The different sales channels in the market are online and offline.
Key players in the market are Latamautos Mexico, S. de RL de CV, Dalton Corporativo, AUTOCOM SEMINUEVOS, SAPI DE CV, Grupo Seminuevos Coapa, Zapata Corporation, S.A. de C.V., Toyota Motor Corporation, Car One SA, CHECK MOVILIDAD SA (KAVAK), CarAgencia S.A, Chileautos SpA, AUTOSUSADOS CHILE, and AUTOMAX SAS, among others.
The market is estimated to witness healthy growth in the forecast period of 2025-2034 to reach a value of around USD 116.15 Billion by 2034.
Explore our key highlights of the report and gain a concise overview of key findings, trends, and actionable insights that will empower your strategic decisions.
| REPORT FEATURES | DETAILS |
| Base Year | 2024 |
| Historical Period | 2018-2024 |
| Forecast Period | 2025-2034 |
| Scope of the Report |
Historical and Forecast Trends, Industry Drivers and Constraints, Historical and Forecast Market Analysis by Segment:
|
| Breakup by Vehicle Type |
|
| Breakup by Fuel Type |
|
| Breakup by Vendor Type |
|
| Breakup by Sales Channel |
|
| Breakup by Region |
|
| Market Dynamics |
|
| Competitive Landscape |
|
| Companies Covered |
|
Datasheet
One User
USD 2,499
USD 2,249
tax inclusive*
Single User License
One User
USD 3,999
USD 3,599
tax inclusive*
Five User License
Five User
USD 4,999
USD 4,249
tax inclusive*
Corporate License
Unlimited Users
USD 5,999
USD 5,099
tax inclusive*
*Please note that the prices mentioned below are starting prices for each bundle type. Kindly contact our team for further details.*
Flash Bundle
Small Business Bundle
Growth Bundle
Enterprise Bundle
*Please note that the prices mentioned below are starting prices for each bundle type. Kindly contact our team for further details.*
Flash Bundle
Number of Reports: 3
20%
tax inclusive*
Small Business Bundle
Number of Reports: 5
25%
tax inclusive*
Growth Bundle
Number of Reports: 8
30%
tax inclusive*
Enterprise Bundle
Number of Reports: 10
35%
tax inclusive*
How To Order
Our step-by-step guide will help you select, purchase, and access your reports swiftly, ensuring you get the information that drives your decisions, right when you need it.

Select License Type
Choose the right license for your needs and access rights.

Click on ‘Buy Now’
Add the report to your cart with one click and proceed to register.

Select Mode of Payment
Choose a payment option for a secure checkout. You will be redirected accordingly.
Track prices with detailed trend reports.

Analyse trade data for supply chain insights.

Leverage cost reports for smart savings

Enhance supply chain with partnerships.

Gain insights to stay ahead and seize opportunities.

Get insights & trends for a competitive edge.

Track prices with detailed trend reports.
Analyse trade data for supply chain insights.
Leverage cost reports for smart savings
Enhance supply chain with partnerships.
Gain insights to stay ahead and seize opportunities.
Get insights & trends for a competitive edge.
Track prices with detailed trend reports.
Analyse trade data for supply chain insights.
Connect For More Information
Our expert team of analysts will offer full support and resolve any queries regarding the report, before and after the purchase.
Our expert team of analysts will offer full support and resolve any queries regarding the report, before and after the purchase.
We employ meticulous research methods, blending advanced analytics and expert insights to deliver accurate, actionable industry intelligence, staying ahead of competitors.
Our skilled analysts offer unparalleled competitive advantage with detailed insights on current and emerging markets, ensuring your strategic edge.
We offer an in-depth yet simplified presentation of industry insights and analysis to meet your specific requirements effectively.
Australia
63 Fiona Drive, Tamworth, NSW
+61-448-061-727
India
C130 Sector 2 Noida, Uttar Pradesh 201301
+91-723-689-1189
Philippines
40th Floor, PBCom Tower, 6795 Ayala Avenue Cor V.A Rufino St. Makati City,1226.
+63-287-899-028, +63-967-048-3306
United Kingdom
6 Gardner Place, Becketts Close, Feltham TW14 0BX, Greater London
+44-753-713-2163
United States
30 North Gould Street, Sheridan, WY 82801
+1-415-325-5166
Vietnam
193/26/4 St.no.6, Ward Binh Hung Hoa, Binh Tan District, Ho Chi Minh City
+84-865-399-124
United States (Head Office)
30 North Gould Street, Sheridan, WY 82801
+1-415-325-5166
Australia
63 Fiona Drive, Tamworth, NSW
+61-448-061-727
India
C130 Sector 2 Noida, Uttar Pradesh 201301
+91-723-689-1189
Philippines
40th Floor, PBCom Tower, 6795 Ayala Avenue Cor V.A Rufino St. Makati City, 1226.
+63-287-899-028, +63-967-048-3306
United Kingdom
6 Gardner Place, Becketts Close, Feltham TW14 0BX, Greater London
+44-753-713-2163
Vietnam
193/26/4 St.no.6, Ward Binh Hung Hoa, Binh Tan District, Ho Chi Minh City
+84-865-399-124


Share