

Consumer Insights
Uncover trends and behaviors shaping consumer choices today
Procurement Insights
Optimize your sourcing strategy with key market data
Industry Stats
Stay ahead with the latest trends and market analysis.

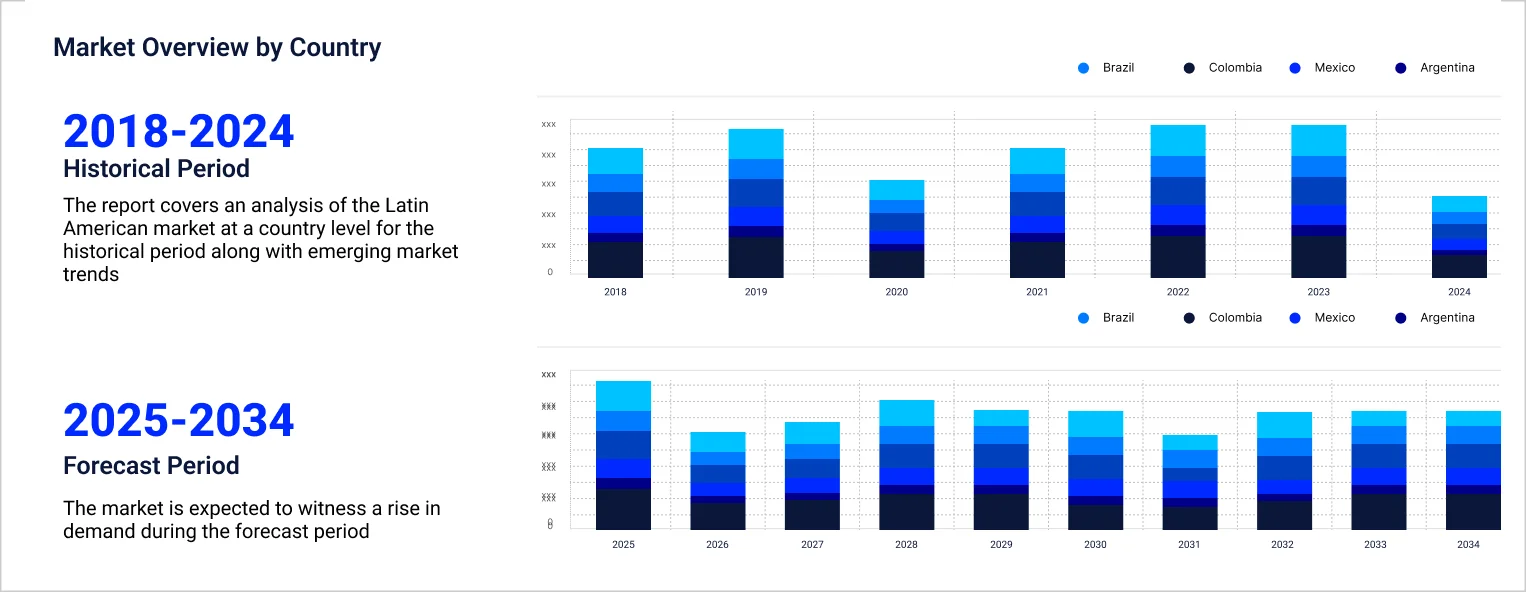
The Latin America meal replacement market size reached around USD 1.32 Billion in 2025. The market is projected to grow at a CAGR of 8.10% between 2026 and 2035 to reach nearly USD 2.88 Billion by 2035. The market growth can be attributed to the growing prevalence of diabetes and obesity in different countries and evolving consumer attitudes towards snacking products. Rapid urbanisation and rising consumer disposable incomes are also expected to drive the market growth in the coming years.
Base Year
Historical Period
Forecast Period
The growing per-capita income in countries such as Brazil is prompting consumers to spend more on healthy food and beverage solutions, including meal replacement products such as bars, shakes, and ready-to-drink (RTD) beverages. As per the Brazilian Institute of Geography and Statistics, the per capita income of Brazilians has grown by 11.5% to BRL 1848 in 2022. With increasing disposable incomes, customers are expected to prioritise convenience without compromising on health. This is likely to surge the demand for meal replacement products that are portable and nutritionally balanced.
Consumers are increasingly preferring e-commerce platforms to purchase meal replacement solutions as they offer enhanced convenience, provide personalised shopping experiences, and boast a wide variety of products. Hence, the robust growth of the e-commerce sector is creating lucrative Latin America meal replacement market opportunities. Reportedly, the e-commerce sector in Brazil is projected to exceed USD 200 billion by 2026. This rise of e-commerce is also prompting meal replacement brands to implement subscription-based models, ensuring their consistent revenues and increasing their profitability.
With the growing prevalence of diabetes in the region due to sedentary lifestyles, the demand for meal replacement products that have a low glycaemic index and can manage blood sugar levels while promoting balanced nutrition is increasing. As per the National Institute of Public Health, the incidence of diabetes in people aged 20 or above in Mexico increased from 16.8% in 2018 to 18.3% in 2022. This growing prevalence of diabetes is also anticipated to encourage customers to adopt meal replacements as a preventative health solution.
Compound Annual Growth Rate
8.1%
Value in USD Billion
2026-2035
*this image is indicative*
|
Latin America Meal Replacement Market Report Summary |
Description |
Value |
|
Base Year |
USD Billion |
2025 |
|
Historical Period |
USD Billion |
2019-2025 |
|
Forecast Period |
USD Billion |
2026-2035 |
|
Market Size 2025 |
USD Billion |
1.32 |
|
Market Size 2035 |
USD Billion |
2.88 |
|
CAGR 2019-2025 |
Percentage |
XX% |
|
CAGR 2026-2035 |
Percentage |
8.10% |
|
CAGR 2026-2035 - Market by Country |
Brazil |
8.4% |
|
CAGR 2026-2035 - Market by Country |
Mexico |
7.9% |
|
CAGR 2026-2035 - Market by Purpose |
Slimming |
8.8% |
|
CAGR 2026-2035 - Market by Distribution Channel |
Online Channels |
14.2% |
|
2025 Market Share by Country |
Argentina |
10.3% |
The growing prevalence of obesity in Latin American countries is directly influencing the demand for meal replacement solutions. These food products enable consumers to control their calorie intake, improve insulin sensitivity, and reduce contact with problem foods, thereby enhancing overall health and well-being. For instance, in Mexico, the number of adult women (41.0%), suffering from obesity is comparatively higher than men (33.0%), with the overall prevalence of obesity recorded at 37.1%. However, numerous consumer studies suggest that the prevalence of obesity among men has increased by 78% during 2000-23 in Mexico, which has accelerated the demand for meal replacement solutions.
As per the Latin America meal replacement market analysis, the market growth can be attributed to evolving consumer attitudes towards meal replacement solutions, who are replacing them with snacking items. Major companies are formulating meal replacement soups and powders rich in vitamins A, B, and C, along with calcium and iron, to reduce the incidence of nutritional deficiencies among consumers. The Latin America meal replacement market expansion is also being driven by the increasing demand for weight loss products and low-sugar items packaged in recycled packaging solutions for diabetics.
Rise of the flexitarian population in Brazil; the increasing application of guarana; the growing focus on better-for-you eating; and rising concerns about weight management are the major factors driving the Latin America meal replacement market growth.
Though Brazil is the third largest producer of meat products globally, around 14% of its population identifies themselves as vegetarian. Over the forecast period, rising eco-consciousness among consumers is expected to prompt market players to introduce innovative meal replacement solutions derived from ethical plant-based sources, thereby facilitating the market expansion.
Latin America produces 96% of the global demand for guarana. It contains bioactive compounds like caffeine and methylxanthines, which are clinically proven to increase energy levels and cognitive function. It is extensively used in manufacturing food supplements, snacks, and cereal bars.
The evolving dietary preferences of consumers and the strengthening of government regulations on food safety have prompted companies like Nestle to reduce the fat and sugar content of their products. For instance, Nestle has removed over 350 tons of sodium, 6,900 tons of sugar, and 5,000 tons of saturated fats from its product range in Brazil, which has led to the growth of Latin America meal replacement market.
Obesity has emerged as a significant challenge for Latin American countries as the consumption of sugary drinks and ultra-processed foods has reached alarming levels. This has prompted consumers to switch to low-carb, protein-rich meal replacement solutions.

Rise of the flexitarian population in Brazil
Meal replacement companies are expected to make substantial investments to adapt to the evolving dietary preferences of Brazilian consumers. Based on consumer studies, people switch to a flexitarian diet for numerous reasons, including environmental concerns regarding meat production, rising health consciousness, increasing priority for animal welfare and other ethical considerations, and allergies or intolerances. Over the forecast period, plant-based meal replacement solutions are expected to become dominant, thereby fuelling the Latin America meal replacement market development.
Increasing application of guarana
Guarana has 30x more caffeine content (2%-7.5%) than cocoa, green tea, and other stimulant beverages available in the market. It is rich in antioxidants due to the presence of tannins (12%), reducing the risk of diabetes, cardiovascular diseases, and rapid ageing. It is found in Bahia and the Amazonas region of Brazil. Its rising commercial usage is expected to favourably shape the Latin America meal replacement market dynamics in the coming years.
The EMR’s report titled “Latin America Meal Replacement Market Report and Forecast 2026-2035” offers a detailed analysis of the market based on the following segments:
Breakup by Product
Breakup by Purpose
Breakup by Flavour
Breakup by Distribution Channel
Breakup by Country
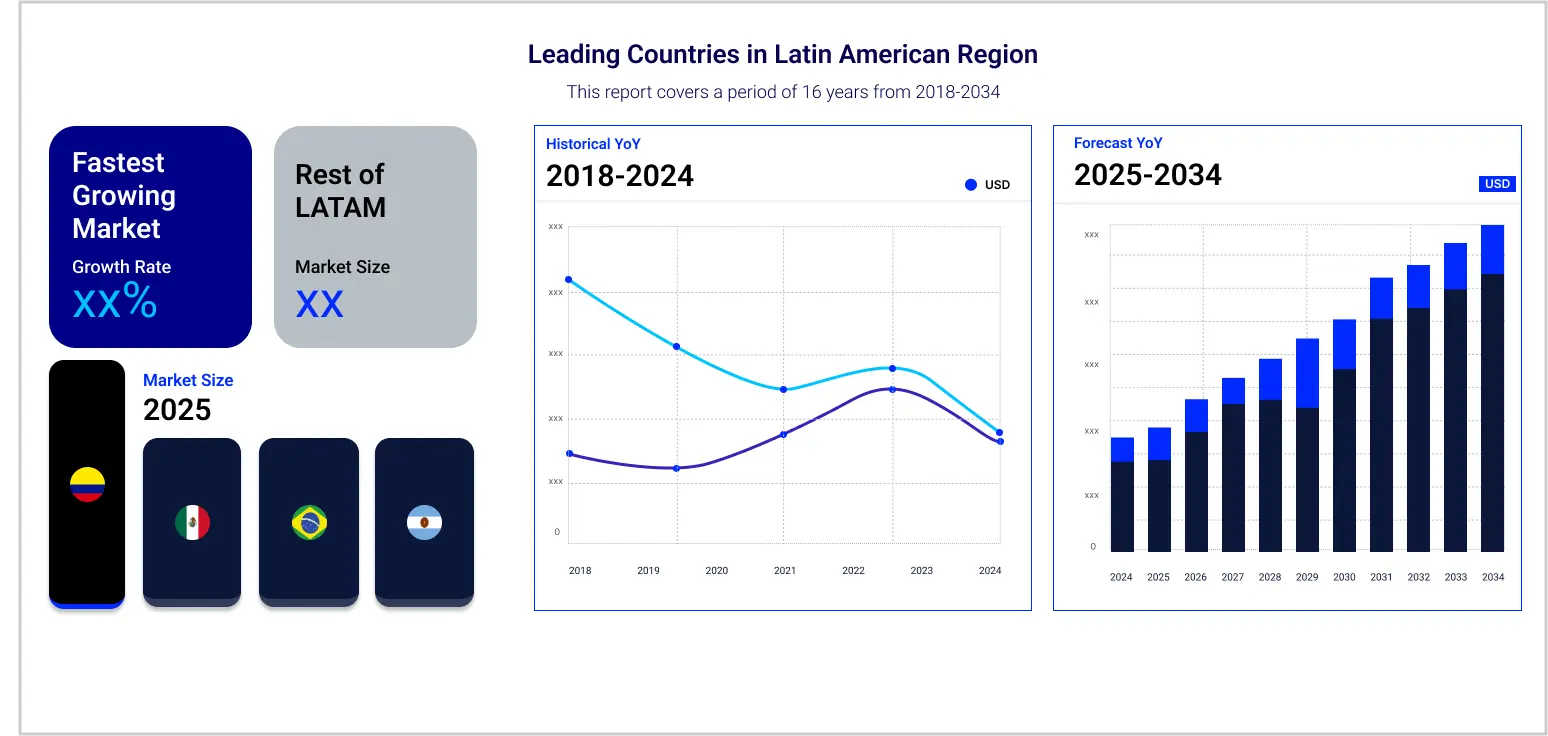
Based on country, the market is segmented into Brazil, Argentina, Mexico, Colombia, and Chile, among others. Argentina is projected to dominate the market, representing 10.3% of the overall market share. Brazil and Mexico are expected to grow at a CAGR of 8.4% and 7.9% respectively, between 2026 and 2035 due to the introduction of new meal replacement shakes in novel flavours and the rising concerns regarding weight management among consumers.
Based on distribution channel, the market is segmented into hypermarkets/supermarkets, convenience stores, speciality stores, and online channels, among others. As per the Latin America meal replacement market analysis, online channels and speciality stores are expected to grow at a rate of 14.2% and 8.6%, respectively, during the forecast period of 2026-2035 due to evolving consumer purchasing behaviours.
|
CAGR 2026-2035 - Market by |
Distribution Channel |
|
Online Channels |
14.2% |
|
Speciality Stores |
8.6% |
|
Hypermarkets/Supermarkets |
XX% |
|
Convenience Stores |
XX% |
|
Others |
XX% |
Major players are capitalising on the growing consumer demand for snackable meal replacement solutions due to the increase in inflation levels. Moreover, the soaring appeal for plant-based products is expected to increase the rate of Latin America meal replacement market development in the coming years.
ALPINA PRODUCTOS ALIMENTICIOS SAS BIC was founded in 1945 and is headquartered in Colombia. It specialises in the production of dairy products, desserts, and other food items.
Amway Corporation is an American multinational company that was established in 1959. Headquartered in Michigan, it specialises in manufacturing and marketing home care products, apart from health and wellness solutions in over 100 countries globally.
Herbalife Nutrition Limited was founded in 1980 and is headquartered in Los Angeles, United States. It is engaged in manufacturing health and wellness products in over 90 countries worldwide.
Glanbia plc was founded in 1964 and is headquartered in Kilkenny, Ireland. It specialises in manufacturing protein supplements, lifestyle nutrition products, vitamins and minerals premixes, and dairy products, among other items.
*Please note that this is only a partial list; the complete list of key players is available in the full report. Additionally, the list of key players can be customized to better suit your needs.*
Other players included in the Latin America meal replacement market report are Nestle S.A, Bob's Red Mill Natural Foods, Inc., La Sibila, Golden Omega S.A., Fisionutri, and TRUST GROUP, among others.


Upto 15% Off
USD
$3999 $3599
$2499 $2249
$4999 $4249
$5999 $5099


*While we strive to always give you current and accurate information, the numbers depicted on the website are indicative and may differ from the actual numbers in the main report. At Expert Market Research, we aim to bring you the latest insights and trends in the market. Using our analyses and forecasts, stakeholders can understand the market dynamics, navigate challenges, and capitalize on opportunities to make data-driven strategic decisions.*
Get in touch with us for a customized solution tailored to your unique requirements and save upto 35%!
In 2025, the market reached an approximate value of USD 1.32 Billion.
The market is projected to grow at a CAGR of 8.10% between 2026 and 2035.
The market is estimated to witness healthy growth in the forecast period of 2026-2035 to reach a value of around USD 2.88 Billion by 2035.
The countries considered in the market report include Brazil, Argentina, Mexico, Colombia, and Chile, among others.
The different meal replacement products available in the market are soups, and shakes, among others.
Consumers purchase meal replacement products for body building or slimming.
The different distribution channels for meal replacement products are hypermarkets/supermarkets, convenience stores, speciality stores, and online channels, among others.
Key players in the market are Nestle S.A, Herbalife Nutrition Limited, Glanbia plc, Bob's Red Mill Natural Foods, Inc., ALPINA PRODUCTOS ALIMENTICIOS SAS BIC, La Sibila, Golden Omega S.A., Fisionutri, TRUST GROUP, and Amway Corporation, among others.
Explore our key highlights of the report and gain a concise overview of key findings, trends, and actionable insights that will empower your strategic decisions.
| REPORT FEATURES | DETAILS |
| Base Year | 2025 |
| Historical Period | 2019-2025 |
| Forecast Period | 2026-2035 |
| Scope of the Report |
Historical and Forecast Trends, Industry Drivers and Constraints, Historical and Forecast Market Analysis by Segment:
|
| Breakup by Product |
|
| Breakup by Purpose |
|
| Breakup by Flavour |
|
| Breakup by Distribution Channel |
|
| Breakup by Region |
|
| Market Dynamics |
|
| Competitive Landscape |
|
| Companies Covered |
|
Single User License
One User
USD 3,999
USD 3,599
tax inclusive*
Datasheet
One User
USD 2,499
USD 2,249
tax inclusive*
Five User License
Five User
USD 4,999
USD 4,249
tax inclusive*
Corporate License
Unlimited Users
USD 5,999
USD 5,099
tax inclusive*
*Please note that the prices mentioned below are starting prices for each bundle type. Kindly contact our team for further details.*
Flash Bundle
Small Business Bundle
Growth Bundle
Enterprise Bundle
*Please note that the prices mentioned below are starting prices for each bundle type. Kindly contact our team for further details.*
Flash Bundle
Number of Reports: 3
20%
tax inclusive*
Small Business Bundle
Number of Reports: 5
25%
tax inclusive*
Growth Bundle
Number of Reports: 8
30%
tax inclusive*
Enterprise Bundle
Number of Reports: 10
35%
tax inclusive*
How To Order

Select License Type
Choose the right license for your needs and access rights.

Click on ‘Buy Now’
Add the report to your cart with one click and proceed to register.

Select Mode of Payment
Choose a payment option for a secure checkout. You will be redirected accordingly.
Gain insights to stay ahead and seize opportunities.

Get insights & trends for a competitive edge.

Track prices with detailed trend reports.

Analyse trade data for supply chain insights.

Leverage cost reports for smart savings

Enhance supply chain with partnerships.

Connect For More Information
Our expert team of analysts will offer full support and resolve any queries regarding the report, before and after the purchase.
Our expert team of analysts will offer full support and resolve any queries regarding the report, before and after the purchase.
We employ meticulous research methods, blending advanced analytics and expert insights to deliver accurate, actionable industry intelligence, staying ahead of competitors.
Our skilled analysts offer unparalleled competitive advantage with detailed insights on current and emerging markets, ensuring your strategic edge.
We offer an in-depth yet simplified presentation of industry insights and analysis to meet your specific requirements effectively.


Share