

Consumer Insights
Uncover trends and behaviors shaping consumer choices today
Procurement Insights
Optimize your sourcing strategy with key market data
Industry Stats
Stay ahead with the latest trends and market analysis.
Trending Now


The global laminated veneer lumber market attained a volume of 5116.80 Thousand CBM in 2024. The market is estimated to grow at a CAGR of 4.00% during 2025-2034 to reach a volume of 7574.11 Thousand CBM by 2034.
Base Year
Historical Year
Forecast Year
As of April 2021, around 5 billion pallets were in use globally, with 90% of these pellets produced from wood.
By 2030, the World Green Building Council (World GBC) aims that all new buildings, infrastructure and renovations should have at least 40% less embodied carbon. Further, all new buildings should have net zero operational carbon.
By 2030, China aims to achieve 50% of its new construction to be green, while Singapore aims to achieve 80% of its new construction to be green.


Value in Thousand CBM
2025-2034
Laminated Veneer Lumber Market Outlook
*this image is indicative*
Laminated veneer lumber (LVL) is an engineered wood product. LVL’s strength and durability are comparable to steel and concrete structures. Its exceptional strength, lightweight, and sustainability are aiding its adoption in residential and commercial construction.
According to the International Energy Agency (IEA) in 2022, to achieve the Net Zero Emissions by 2050 Scenario (NZE Scenario), the construction sector globally, needs to retrofit at least 20% of its existing building stock to a zero-carbon-ready level by 2030. Compared to energy-intensive traditional building materials, such as cement, iron, and steel, LVL offers an eco-friendlier production while simultaneously serving as a carbon stock.
The carbon dioxide stored in wood remains in LVL products throughout their lifecycle and is not released back into the carbon cycle. LVL and CLT yield a substantial substitution effect of 1 – 2.5 tonnes CO2 for every cubic meter (m3) of engineered wood or 2 – 5 tonnes per ton of engineered wood, with a typical density of around 0.5 kg/m3. Engineered wood products are accredited by various sustainable certifications and green building programs, such as the Leadership in Energy and Environmental Design (LEED) certification.
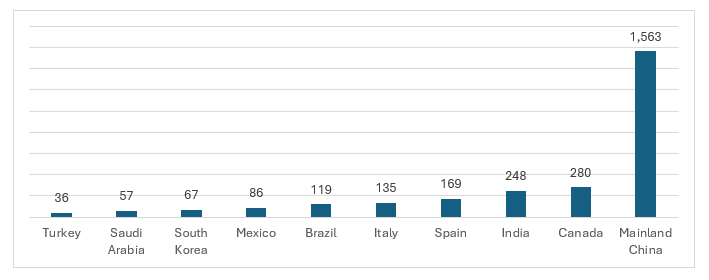
In 2023, Mainland China held the majority of LEED-certified buildings globally, with 1,563 LEED projects.
Figure: Top 10 Countries with the Most Number of LEED Certified Projects, 2023
Environment friendly characteristics of LVL; increasing adoption of wood in construction; ability to manufacture unique furniture designs; and presence of a variety of raw materials for the production of LVL are the key trends impacting the laminated veneer lumber market growth.
Compared to energy-intensive building materials like cement, iron, and steel, engineered wood products, such as LVL are produced in an environmentally friendly manner and serve as a carbon stock. The CO2 stored in wood remains in LVL products throughout their lifecycle and is not released back into the carbon cycle.
Building materials contribute to around 11% of global carbon emissions. There is a rising demand for wood-based construction, especially in urban areas as they offer the benefits of lightweight and sustainability. LVL is a highly efficient wood-based building material. It enables increased prefabrication, facilitating increased output, faster payback, and high-quality construction.
LVL is widely being adopted in furniture production as it can be designed into a variety of shapes. It is lightweight yet durable and has the potential to meet the rising demand for innovative furniture to enhance the functionality and aesthetic appeals of homes and commercial spaces.
LVL plywood can be made from a variety of common woods such as pine, acacia, eucalyptus, and rubberwood. These woods are favoured for their widespread availability, cost-effectiveness, and ability to create strong engineered wood products like LVL.


Wood is increasingly being used as a construction material, owning to its ease of transportation and handling compared to materials like concrete or bricks. Typically, LVL, an engineered wood product, can be produced in a variety of shapes depending on its use.
LVL structural elements can be opted in prefabricated construction, due to its lightweight. These solutions reduce build time and translates to faster construction times and fewer errors on the building site. Additionally, LVL's lighter weight compared to traditional materials can provide builders to utilize smaller cranes and foundations, streamlining the construction process and potentially reducing costs.
Also, LVL offers impressive strength and insulating properties, enabling the construction of more energy-efficient structures compared to traditional concrete or masonry alternatives. LVL is typically made from softwood. In Europe, spruce and pine are common, while North American manufacturers use various pine species, Douglas fir, western hemlock, yellow poplar, and red maple to produce LVL plywood.
Read more about this report - REQUEST FREE SAMPLE COPY IN PDF
“Global Laminated Veneer Lumber Market Report and Forecast 2025-2034” offers a detailed analysis of the market based on the following segments:
Market Breakup by Application
Market Breakup by End Use
Market Breakup by Region
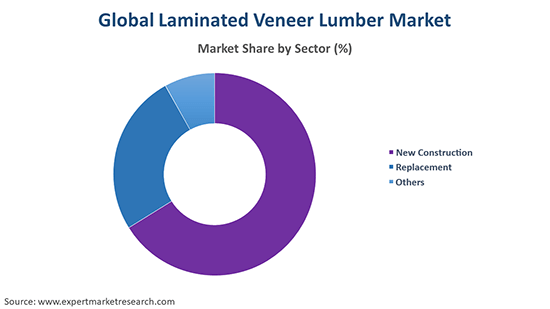
Based on application, the residential sector accounts for a significant share of the market
There is a rising popularity of wood-based construction in Europe. Around 70% of the wood consumed in the EU is used in construction and furnishings. Further, around 8-10% of single-family homes in the EU have a wooden frame. LVL is widely deployed in permanent structural applications, such as beams, lintels, and truss chords.
As of August 2023, Germany held the largest housing stock in Europe with 43.4 million dwellings. France and Spain followed Germany with 37.6 million and 26.1 million dwellings, respectively.
Based on end use, the construction sector is a major contributor to the laminated veneer lumber market revenue
Construction companies are focusing on building materials, such as LVL that are functional and environmentally responsible. LVL studs can be up to 2.5 times stronger than standard framing lumber of the same dimension in compression and tension. Hence it provides exceptional strength against wind and shear loads.
The market players are focusing on providing products at competitive prices and high quality, with improved customer service, product support, and performance features.
Murphy Company produces hardwood and softwood plywood, engineered wood, and veneer in the Pacific Northwest. The company has a strong presence in the United States, with 6 mills including 1 plant of softwood plywood and 3 softwood veneer plants and 2 division offices.
METSÄ Group Companies, also known as METSÄ Group, is an international operator in sustainable bioeconomy. The company produces 34 million m3 wood procured, with 85% of the wood from Finland, and 15% from elsewhere in Northern Europe.
The company is engaged in providing products such as engineered wood, lumber, composite panels, and hardwood. The company conducts manufacturing operations within the United States and distributes its products across North America.
STEICO develops, produces, and markets ecological construction products made of renewable raw materials. The company’s headquarters with an employee base of around 150 is located in Germany, while the other sites include Poland and France.
*Please note that this is only a partial list; the complete list of key players is available in the full report. Additionally, the list of key players can be customized to better suit your needs.*
Other notable players operating in the laminated veneer lumber market are Stora Enso Oyj, Boise Cascade Company, Weyerhaeuser Company, Pacific Woodtech Corporation, and Juken New Zealand Ltd., among others.
North America is one of the leading regional markets for LVL. The United States is witnessing a rapid adoption of engineering wood, as it provides a lower carbon footprint than traditional steel and concrete, while also being cost-effective. As of June 2023, the United States had the presence of 1,860 completed or planned engineering wood construction projects.
Wood as a construction material is being favoured in the Chinese market due to its advantages of sustainability and low-carbon environmental protection. The application of engineered wood is increasing at a significant rate, with the increased promotion of the trend of 'carbon neutrality' and 'carbon peaking.
Laminated Veneer Lumber Market Size
Laminated Veneer Lumber Market Growth
Laminated Veneer Lumber Market Trends
Laminated Veneer Lumber Market Share
*While we strive to always give you current and accurate information, the numbers depicted on the website are indicative and may differ from the actual numbers in the main report. At Expert Market Research, we aim to bring you the latest insights and trends in the market. Using our analyses and forecasts, stakeholders can understand the market dynamics, navigate challenges, and capitalize on opportunities to make data-driven strategic decisions.*
Get in touch with us for a customized solution tailored to your unique requirements and save upto 35%!
The market attained a volume of 5116.80 Thousand CBM in 2024.
The market is estimated to grow at a CAGR of 4.00% during 2025-2034.
The market is estimated to witness a healthy growth in the forecast period of 2025-2034 to reach a volume of 7574.11 Thousand CBM by 2034.
The factors driving the market growth are increasing inclination towards environmental safety and sustainability, rising adoption of wood as a construction material, and favourable government initiatives supporting the adoption of wood.
The key regional markets for laminated veneer lumber are North America, Europe, the Asia Pacific, Latin America, and the Middle East and Africa.
The end uses include construction and non-construction.
The applications include residential, commercial, and others.
The key players in the market include Murphy Company, METSÄ Group Companies, Roseburg Forest Products Co., STEICO SE, Stora Enso Oyj, Boise Cascade Company, Weyerhaeuser Company, Pacific Woodtech Corporation, and Juken New Zealand Ltd. among others.
Explore our key highlights of the report and gain a concise overview of key findings, trends, and actionable insights that will empower your strategic decisions.
| REPORT FEATURES | DETAILS |
| Base Year | 2024 |
| Historical Period | 2018-2024 |
| Forecast Period | 2025-2034 |
| Scope of the Report |
Historical and Forecast Trends, Industry Drivers and Constraints, Historical and Forecast Market Analysis by Segment:
|
| Breakup by Application |
|
| Breakup by End Use |
|
| Breakup by Region |
|
| Market Dynamics |
|
| Competitive Landscape |
|
| Companies Covered |
|
| Report Price and Purchase Option | Explore our purchase options that are best suited to your resources and industry needs. |
| Delivery Format | Delivered as an attached PDF and Excel through email, with an option of receiving an editable PPT, according to the purchase option. |
Datasheet
One User
USD 2,499
USD 2,249
tax inclusive*
Single User License
One User
USD 3,999
USD 3,599
tax inclusive*
Five User License
Five User
USD 4,999
USD 4,249
tax inclusive*
Corporate License
Unlimited Users
USD 5,999
USD 5,099
tax inclusive*
*Please note that the prices mentioned below are starting prices for each bundle type. Kindly contact our team for further details.*
Flash Bundle
Small Business Bundle
Growth Bundle
Enterprise Bundle
*Please note that the prices mentioned below are starting prices for each bundle type. Kindly contact our team for further details.*
Flash Bundle
Number of Reports: 3
20%
tax inclusive*
Small Business Bundle
Number of Reports: 5
25%
tax inclusive*
Growth Bundle
Number of Reports: 8
30%
tax inclusive*
Enterprise Bundle
Number of Reports: 10
35%
tax inclusive*
How To Order
Our step-by-step guide will help you select, purchase, and access your reports swiftly, ensuring you get the information that drives your decisions, right when you need it.

Select License Type
Choose the right license for your needs and access rights.

Click on ‘Buy Now’
Add the report to your cart with one click and proceed to register.

Select Mode of Payment
Choose a payment option for a secure checkout. You will be redirected accordingly.
Gain insights to stay ahead and seize opportunities.

Get insights & trends for a competitive edge.

Track prices with detailed trend reports.

Analyse trade data for supply chain insights.

Leverage cost reports for smart savings

Enhance supply chain with partnerships.

Connect For More Information
Our expert team of analysts will offer full support and resolve any queries regarding the report, before and after the purchase.
Our expert team of analysts will offer full support and resolve any queries regarding the report, before and after the purchase.
We employ meticulous research methods, blending advanced analytics and expert insights to deliver accurate, actionable industry intelligence, staying ahead of competitors.
Our skilled analysts offer unparalleled competitive advantage with detailed insights on current and emerging markets, ensuring your strategic edge.
We offer an in-depth yet simplified presentation of industry insights and analysis to meet your specific requirements effectively.
Australia
63 Fiona Drive, Tamworth, NSW
+61-448-061-727
India
C130 Sector 2 Noida, Uttar Pradesh 201301
+91-723-689-1189
Philippines
40th Floor, PBCom Tower, 6795 Ayala Avenue Cor V.A Rufino St. Makati City,1226.
+63-287-899-028, +63-967-048-3306
United Kingdom
6 Gardner Place, Becketts Close, Feltham TW14 0BX, Greater London
+44-753-713-2163
United States
30 North Gould Street, Sheridan, WY 82801
+1-415-325-5166
Vietnam
193/26/4 St.no.6, Ward Binh Hung Hoa, Binh Tan District, Ho Chi Minh City
+84-865-399-124
United States (Head Office)
30 North Gould Street, Sheridan, WY 82801
+1-415-325-5166
Australia
63 Fiona Drive, Tamworth, NSW
+61-448-061-727
India
C130 Sector 2 Noida, Uttar Pradesh 201301
+91-723-689-1189
Philippines
40th Floor, PBCom Tower, 6795 Ayala Avenue Cor V.A Rufino St. Makati City, 1226.
+63-287-899-028, +63-967-048-3306
United Kingdom
6 Gardner Place, Becketts Close, Feltham TW14 0BX, Greater London
+44-753-713-2163
Vietnam
193/26/4 St.no.6, Ward Binh Hung Hoa, Binh Tan District, Ho Chi Minh City
+84-865-399-124


Share